



Top Market Opportunity in 2026: A Rise in Volatility Across Markets
There were numerous unexpected developments across the financial system this past year, but perhaps the most prominent and prolific development was the anchoring of the complacent bid. Can the markets continue to back the interests of the long-only speculators?
Share this:

Talking Points:
- Risk appetite swelled and collapsed across the markets after the Liberation Day reciprocal tariffs were announced in April and reversed soon after
- What was initially an opportunistic bid on the dip after the tariff discount, turned into justification through AI and other themes that grew increasingly long-in-the-tooth
- Risk appetite can hold out if fundamental meet the lofty expectations, but expecting low volatility amid an ‘oblivious’ threat outlook well into 2026 seems highly improbable
Markets experienced a few jolts of volatility through the past year – April’s tariffs charge, October’s US government shutdown and November’s monetary policy perspective pivot – but those short-term charges consistently retreated from their extremes and back to the general underlying trend. While the brief bouts of fear provided significant market impact, the persistence of benchmarks for sentiment – like the S&P 500 or Dow Jones Industrial Average – moderated the ultimate impact that these readings would otherwise exert on broader conviction.
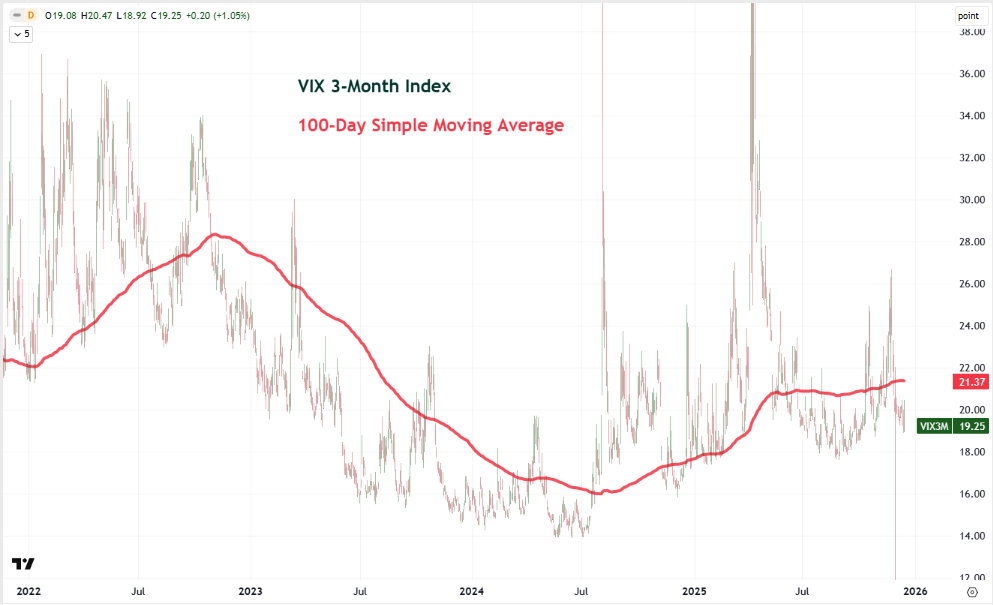
With US indices lingering near record highs and so many other sentiment measures similarly elevated historically, it is easy to fall into a belief that the quiet advance will automatically persist into the new year. This seems further supported by the moderating influence for many of the systemic fundamental themes from the past year: tariff-driven geopolitical risks and inflation expectations; transition of monetary policy trends; economic pacing threats and fiscal stability issues. That said, it is worth noting that the norm with which spikes in volatility reverted to was ultimately on a steady trend higher. For reference, the 13 and 26-week (quarter and half-year) averages of the VIX volatility index have risen substantially from the Summer 2024 lull. We can see similar measure through the medium-term’s 3-month VIX.
Chart of VIX Volatility Index (Daily)
Source: TradingView, John Kicklighter
There is a ‘chicken and the egg’ debate over market volatility. Some believe that volatility will rise when market catalysts present greater uncertainty and thereby price volatility. I agree with that, particularly when it pertains to short-term swells in volatility readings. However, it is more frequently the case that market conditions establish the environment with which event risk draw experiences are greater or lesser market-moving capacity. With the trend in underlying implied volatility rising against the backdrop of record high markets (leading to a discordant risk profile and hedging costs), it seems more likely that the backdrop will establish an environment where updates will trigger bigger movements.
What’s more, this isn’t just a reflection of US markets – much less US equities as is reflected by the VIX – but has the potential for the financial markets at large. Trends higher in speculative assets like equities and Bitcoin as well as financial stability representatives like gold suggest a spillover of uncertainty can happen from core markets across the board. And, ultimately, the wider the reach of volatility, the more systemic and persistent it will be for the financial system. When the markets are ready, they will have their pick of traditional justifications to draw from.
Chart of VIX Volatility Index (Daily)

Source: TradingView, John Kicklighter
For taking advantage of volatility, there are a few approaches to take. Attempting to take a view through the derivatives based on measures like the VIX itself are not particularly appealing because of the time restrictions of the derivatives and inherent flaws for some of the more popular exposures (like the VXX iPath Short-Term VIX Futures ETN). Instead, I like to monitor the implied measures as a gauge to reflect a sustainable rebound in conditions. Then, it is finding those underlying markets with a strong correlation (inverted for many) to the VIX itself.
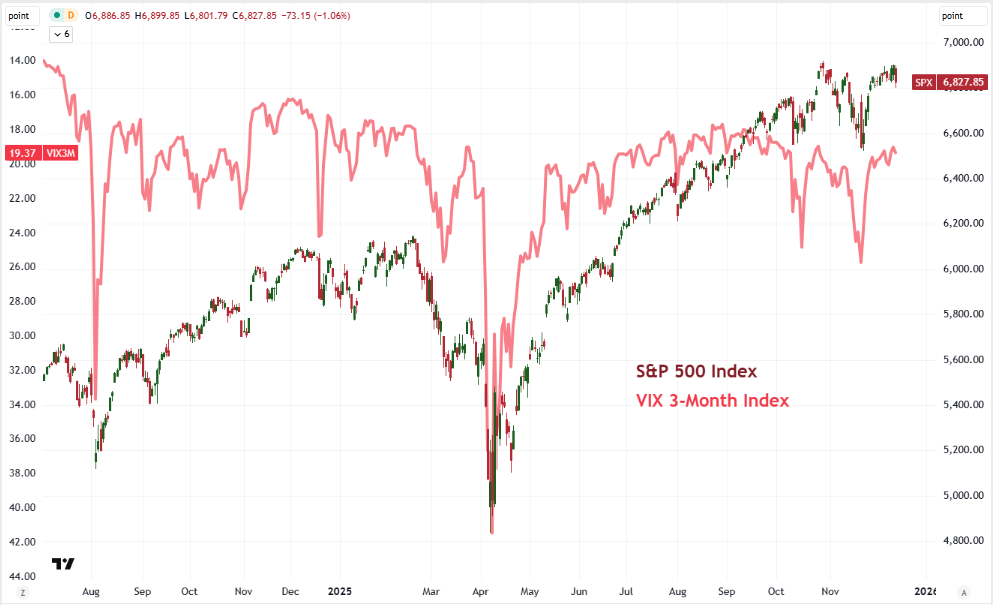
The S&P 500 has one of the most consistent negative correlations to the VIX (across durations) and that should make sense as it is derived from the indices’ derivative measures. That said, the speculative nature of the options pricing the VIX has seemed to override the hedging capacity of the products. That has moderated its signal power for implied (expected) volatility, but it also weakens its guidance capabilities for the S&P 500 itself when separating a quick pullback from a lasting trend.
Chart of S&P 500 and Inverted VIX 3-Month (Daily)
Source: TradingView, John Kicklighter
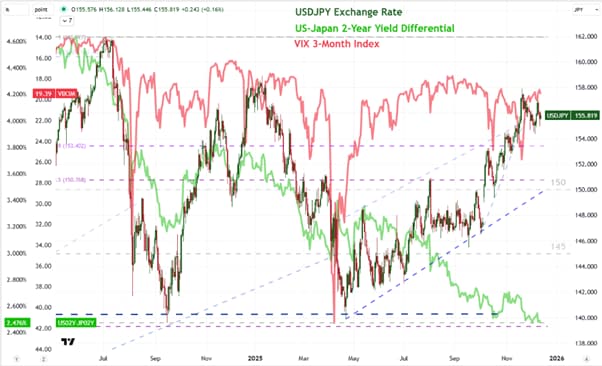
A little further afield than the direct VIX-S&P 500 relation, but adding in additional fundamental consideration, is the USDJPY. Historically, Yen crosses have played the role of carry trade with the Japanese currency providing the ‘funding’, or short side. That is owing to three decades of essentially zero interest rate which has pushed Japanese investors to send their capital abroad for meaningful return. However, the BOJ has been on a slow hiking regime this past year to slowly eat into the carry trade while major counterparts have experienced a dovish cycle from their own monetary policy groups. That has materially lowered the yield differentials for the likes of USDJPY and other crosses.
That said, there remains a hearty positive carry for pairs like USDJPY which can appeal in the environment where complacency keeps risk appetite bid. Alternatively, should fear start to break through the status quo and generate more significant market volatility and broader uncertainty along with it; this carry-price divergence is more likely to close. While the Yen is not necessarily a more appealing haven than the US dollar, the first consideration towards a sentiment shift is to unwind extended exposure (eg long carry) rather than seek out absolute risk-free haven (eg Treasuries priced in dollars). Add to this a pressure from Japanese authorities worried about the purchasing power of a weak Yen, ready to take advantage of market natural market swoons potentially through intervention; and this seems a pair to watch in the context of volatility trends.
Chart of USDJPY, US-Japan 2-Year Yield Differential, Inverted VIX 3-Month (Daily)
Source: TradingView, Standard & Poor’s, John Kicklighter
-- Written by John Kicklighter, Global Head of Content
Related tags:




Open an account in minutes
Experience award-winning platforms with fast and secure execution, and enjoy tight spreads from 0.5 pts on FX and 0.3 pts on indices.
Economic calendar
Web Trader platform
Our sophisticated web-based platform is packed with features.
Related articles

Japanese Yen Surges Across FX Majors as Risk Aversion Intensifies
Safe-haven demand sent the Japanese yen higher across FX majors, while USD/JPY broke lower ahead of Japan's CPI release and next week's BOJ meeting.


EUR/USD Outlook: Can Hot CPI Sustain the Stretched US Dollar Rally?
EUR/USD looks oversold as the US dollar rally loses momentum. With hot CPI expectations potentially priced in, could inflation trigger a dollar pullback?

AUD/USD Eyes Volatility Amid Middle East, Jobs, US CPI Crossfire
AUD/USD faces a volatile week as Middle East tensions, rising oil prices, RBA minutes, Australian jobs and US CPI test the Aussie's recovery.
This report is intended for general circulation only. It should not be construed as a recommendation, or an offer (or solicitation of an offer) to buy or sell any financial products. The information provided does not take into account your specific investment objectives, financial situation or particular needs. Before you act on any recommendation that may be contained in this report, independent advice ought to be sought from a financial adviser regarding the suitability of the investment product, taking into account your specific investment objectives, financial situation or particular needs.
StoneX Financial Pte. Ltd., may distribute reports produced by its respective foreign entities or affiliates within the StoneX group of companies or third parties pursuant to an arrangement under Regulation 32C of the Financial Advisers Regulations. Where the report is distributed to a person in Singapore who is not an accredited investor, expert investor or an institutional investor (as defined in the Securities Futures Act), StoneX Financial Pte. Ltd. accepts legal responsibility to such persons for the contents of the report only to the extent required by law. Singapore recipients should contact StoneX Financial Pte. Ltd. at 6826 9988 for matters arising from, or in connection with the report.
In the case of all other recipients of this report, to the extent permitted by applicable laws and regulations neither StoneX Financial Pte. Ltd. nor its associated companies will be responsible or liable for any loss or damage incurred arising out of, or in connection with, any use of the information contained in this report and all such liability is hereby expressly disclaimed. No representation or warranty is made, express or implied, that the content of this report is complete or accurate.
StoneX Financial Pte. Ltd. is not under any obligation to update this report.
Trading CFDs carries a high level of risk that may not be suitable for some investors. Consider your investment objectives, level of experience, financial resources, risk appetite and other relevant circumstances carefully. The possibility exists that you could lose some or all of your investments, including your initial deposits. If in doubt, please seek independent expert advice. Visit www.forex.com/en-sg/terms-and-policies for the complete Risk Disclosure Statement.