



ASX 200 Outlook: Options Expiry Could Keep the Index Range-Bound
The ASX 200 is expected to open slightly firmer, but options expiry and key gamma resistance suggest another choppy session.
Share this:

The ASX 200 is expected to open slightly firmer following a modest gain in SPI 200 futures overnight, although today's options expiry could keep price action range-bound. While the technical backdrop has improved modestly, the options market continues to point to strong resistance overhead, suggesting traders may be better served fading rallies than chasing a bullish breakout.
I also prefer "Could Keep the Index Range-Bound" over "Could Cap Gains" because it better reflects the analysis: you're expecting two-way trading rather than simply limited upside.
View related analysis:
View related analysis:
ASX 200 Price Action and Options Expiry Analysis
ASX 200 Market Snapshot
- The ASX 200 rose 0.34% to 8823, although market breadth was mixed with 97 advancers versus 92 decliners.
- Materials and Energy led gains, while Health Care, Real Estate and Consumer Discretionary were the weakest sectors.
- The index is attempting to recover after several softer sessions, but the daily trend remains choppy.
- One-day implied volatility fell to 0.56%, although 1-week implied volatility remains elevated at 1.49% ahead of key event risk.
- Friday is historically the most volatile trading day, with an average daily range of 81.6 points over the past year and 105 points over the past three months.
- Ultimately, leadership remains narrow, suggesting the rally lacks broad participation and may struggle to sustain gains unless market breadth improves.
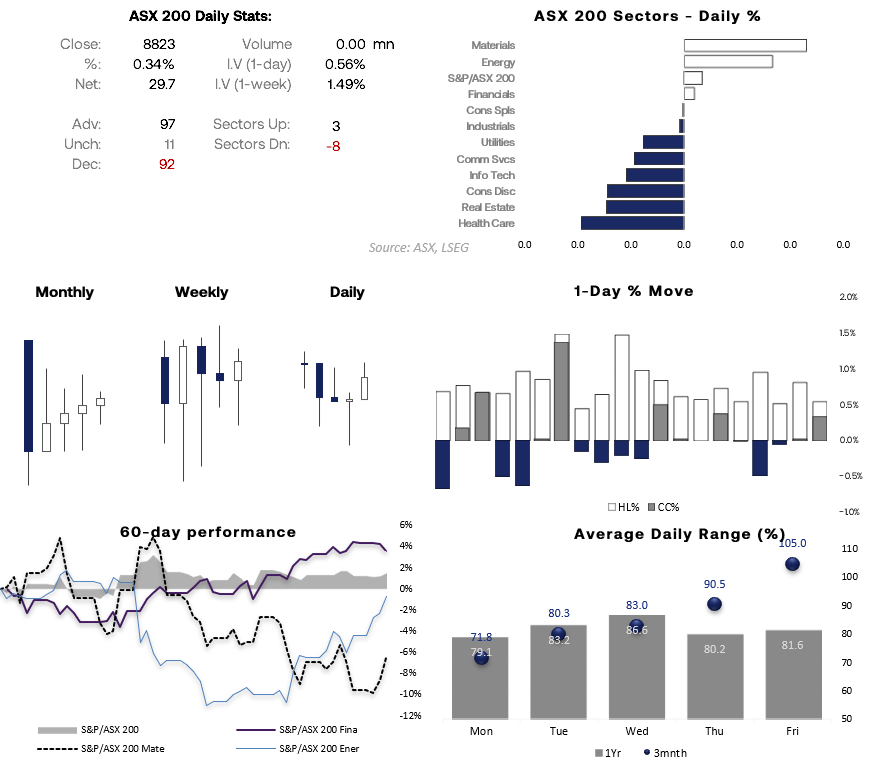
Source: ASX, LSEG
Materials Lead While the ASX Lags Global Peers
- Materials remain the key sector for ASX traders, with Industrials and Telecommunications also showing improving relative strength.
- The Financials sector continues to outperform over the past 60 days, helping underpin the broader index despite mixed sector leadership.
- Unlike many global equity markets, the ASX 200 continues to underperform, highlighting its relatively independent price action.
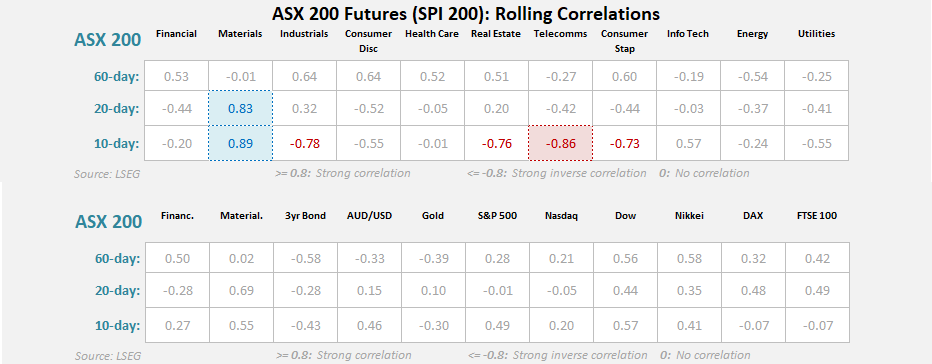
Source: ASX, LSEG
ASX 200 Technical Analysis
The daily ASX cash chart (left) shows price action has remained choppy, with the index effectively moving sideways throughout July. That said, there is a slight bullish bias as the 200-day EMA continues to provide support. Even so, rallies have repeatedly stalled around 8850. With today marking options expiry, I remain sceptical that the positive lead from SPI 200 futures overnight will be enough to trigger a bullish breakout in the ASX 200 cash market. If anything, a move into resistance could provide an opportunity for bears to fade the rally with tactical shorts.
Options Expiry Points to Another Range-Bound Session
Today's expiry profile favours more range trading unless a fresh catalyst emerges. 8975 is the dominant gamma ceiling, with 8900 providing secondary resistance. Together, they create a strong resistance zone into today's close. On the downside, 8775 is the key gamma floor, where heavy put positioning should help support pullbacks unless price is accepted below it.
Next week's options positioning also favours range trading. 8800–8825 is shaping up as the key battleground, while call open interest at 8900 and 8950 should continue to cap rallies. A sustained break above 8900 would open the door to 8975, while acceptance below 8775 would shift focus to the major floor at 8675.
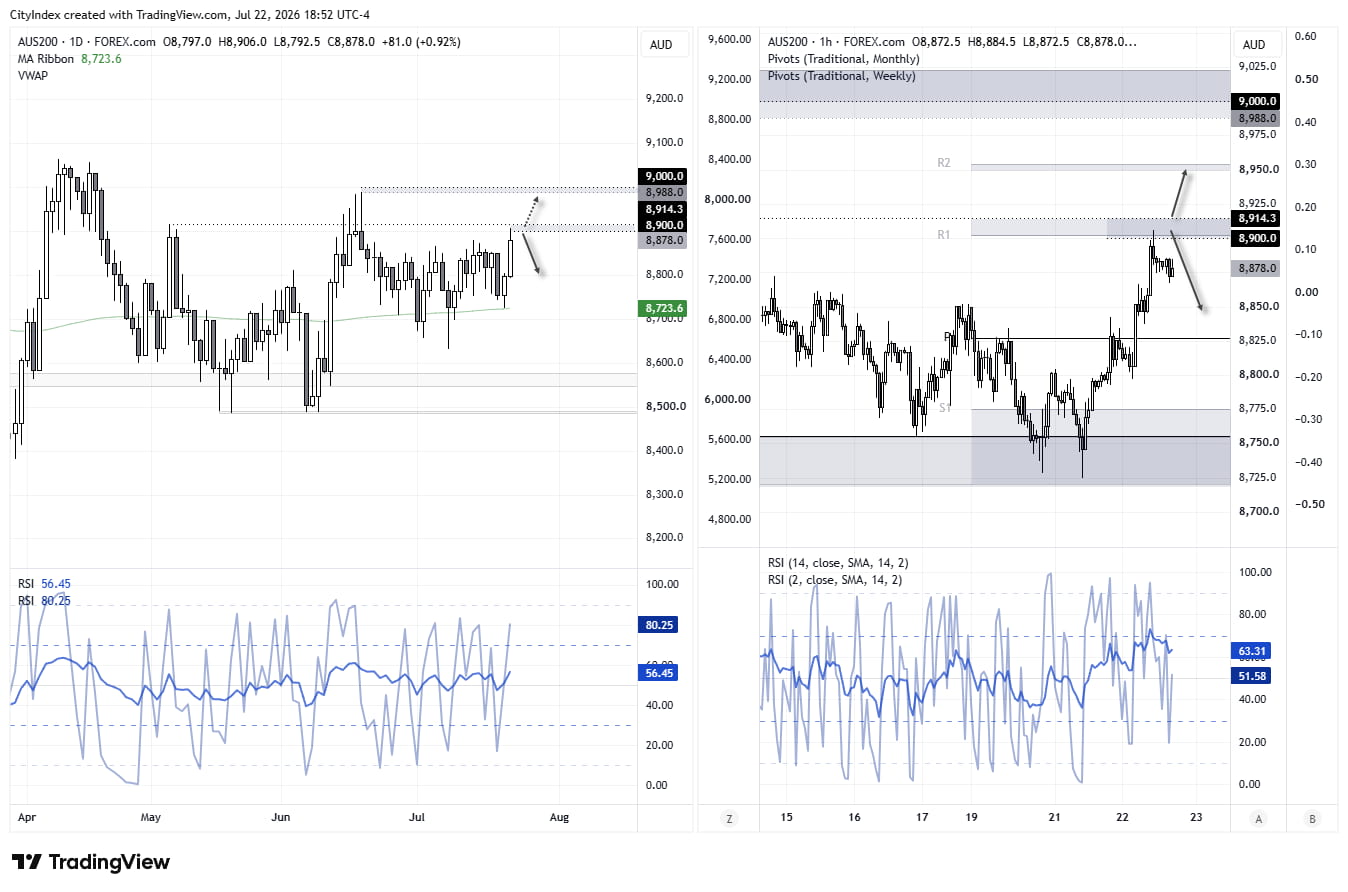
Source: ASX, ASX24, TradingView
ASX 200 Options Summary
- 8975 is the major gamma ceiling, with 8900 acting as secondary resistance.
- 8775 is the key gamma floor and should support pullbacks unless price is accepted below it.
- 8800–8825 is the main battleground, favouring choppy, range-bound trading.
- A sustained break above 8900 exposes 8975.
- Acceptance below 8775 shifts focus to the 8675 gamma floor.


ASX 200 Levels
The 1-hour chart shows a strong rally towards 8900, with a small bull flag forming into the close. Bulls may have another crack at 8900, although weak volume on the rally suggests traders should watch for reversal patterns that could trigger mean reversion lower. Alternatively, a sustained break and hold above 8900 would strengthen the case for a move towards 9000 next week.
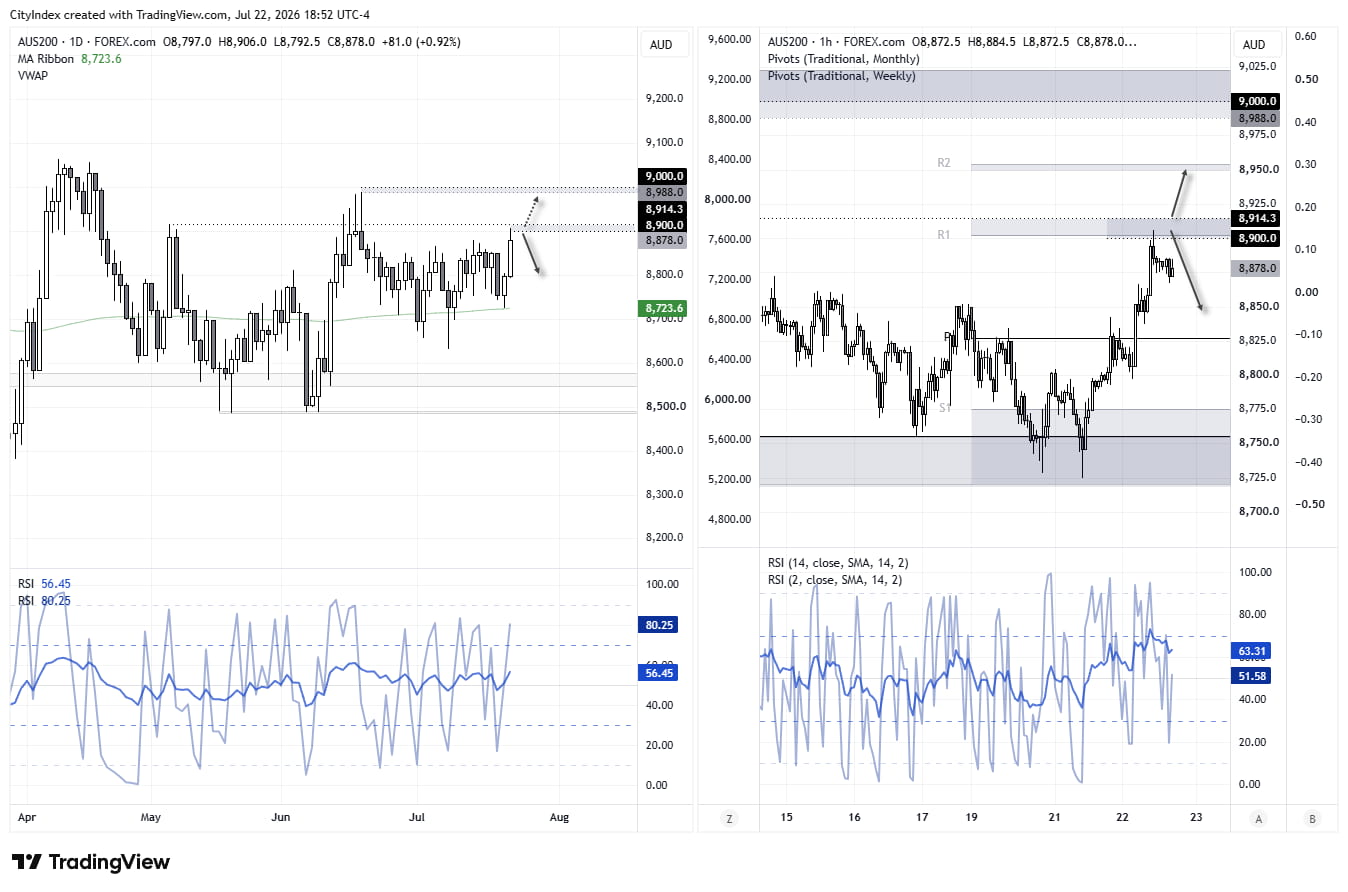
View the full economic calendar
View the full economic calendar
-- Written by Matt Simpson
Follow Matt on Twitter @cLeverEdge
How to trade with City Index
You can trade with City Index by following these four easy steps:
- Open an account, or log in if you’re already a customer
• Open an account in the UK
• Open an account in Australia
• Open an account in Singapore
- Search for the market you want to trade in our award-winning platform
- Choose your position and size, and your stop and limit levels
- Place the trade
Related tags:



Open an account in minutes
Experience award-winning platforms with fast and secure execution.
Economic calendar
Web Trader platform
Our sophisticated web-based platform is packed with features.
Related articles

USD/JPY, AUD/JPY: Central Bank Divergence Creates Two-Way Risk
USD/JPY eyes a breakout above 160, while AUD/JPY faces further losses as Fed, RBA and BoJ interest rate expectations diverge.

AUD/USD Bears Tighten Their Grip Into AU Jobs, RBA Minutes
AUD/USD falls below 68 cents as US dollar strength and peak RBA rate expectations put Australian jobs data and RBA minutes in focus.

Gold, EUR/USD hit 2026 lows as US yields erupt
US Treasury yields have staged one of their largest four-session increases in decades, hammering EUR/USD and gold. But while the euro's decline makes sense, gold's reaction has been extraordinary.
StoneX Financial Ltd (trading as "FOREX.com") is an execution-only service provider. This material, whether or not it states any opinions, is for general information purposes only and it does not take into account your personal circumstances or objectives. This material has been prepared using the thoughts and opinions of the author and these may change. However, FOREX.com does not plan to provide further updates to any material once published and it is not under any obligation to keep this material up to date.
This material is short term in nature and may only relate to facts and circumstances existing at a specific time or day. Nothing in this material is (or should be considered to be) financial, investment, legal, tax or other advice and no reliance should be placed on it. No opinion given in this material constitutes a recommendation by FOREX.com or the author that any particular investment, security, transaction or investment strategy is suitable for any specific person.
The material has not been prepared in accordance with legal requirements designed to promote the independence of investment research. Although FOREX.com is not specifically prevented from dealing before providing this material, FOREX.com does not seek to take advantage of the material prior to its dissemination. This material is not intended for distribution to, or use by, any person in any country or jurisdiction where such distribution or use would be contrary to local law or regulation. For further details see our full non-independent research disclaimer and quarterly summary.