Key Events:
- BTC/USD reaches new record highs at $112,000.
- Crypto market buoyed by regulatory clarity, ETF inflows, and adoption by over 143 public companies holding Bitcoin as reserves, supporting long-term bullish sentiment.
- DXY maintains strength above 96, exerting pressure on major currencies and prompting a correction in GBP/USD below 1.36.
BTCUSD Outlook: Weekly Time Frame – Log Scale
Source: Tradingview
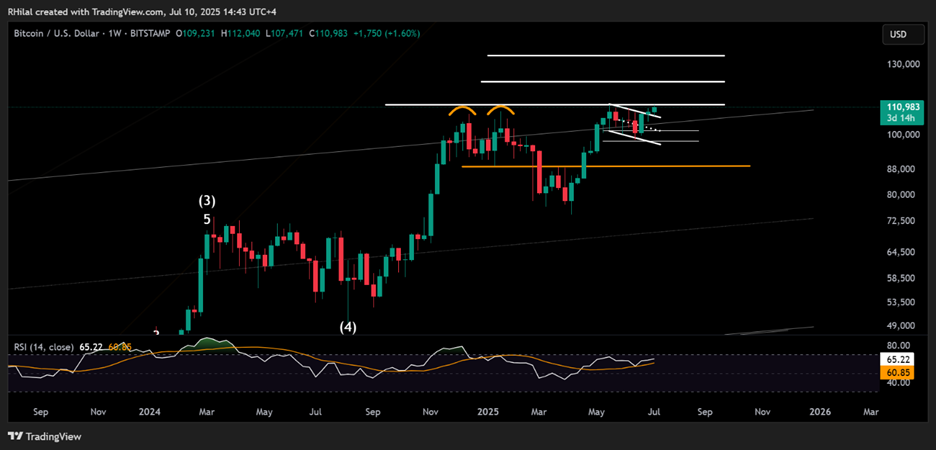
While headlines point toward record highs on the Bitcoin chart, technicals highlight strong resistance at 112,000. A clean hold above this level may extend gains toward 121,000, 134,000, and 150,000, aligning with Fibonacci extension levels of 0.618, 0.786, 1, and 1.272 respectively, based on the trend between the August 2024 low, January 2025 high, and April 2025 low.
On the downside, should a close re-emerge below 110,000, possible support levels for the next rebound may align with 100,000, 97,000, and 89,000.
GBPUSD Outlook: Weekly Time Frame – Log Scale
Source: Tradingview
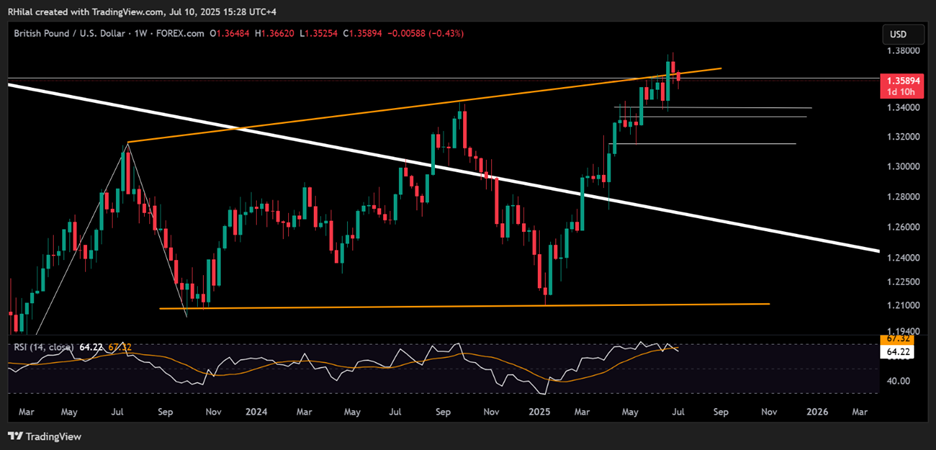
In line with a rebounding Dollar Index from a 17-year trendline, GBPUSD is pulling back toward the 1.35 zone, following an overbought weekly RSI at levels last seen in 2024 and a test of the resistance zone formed by a trendline connecting the highs between July 2023 and September 2024. A clean hold below 1.35 may extend losses toward 1.34, 1.3330, and 1.3140 respectively. On the upside, should dollar weakness resume and GBPUSD closes back above the 1.38 mark, the pair may extend gains toward 1.40.
Written by Razan Hilal, CMT
Follow on X: @Rh_waves