Bitcoin has now accumulated four consecutive bullish sessions, posting a gain of nearly 6% and reaching levels close to 95,000 dollars, a price not seen since the early days of November. For now, this renewed confidence appears to be driven by expectations of an interest rate cut from the U.S. central bank in tomorrow’s announcement—an event that has increased short-term demand for BTC and that could continue acting as a catalyst for stronger buying pressure in the coming sessions.

Do Lower Rates Bring Demand Back?
With one day left before the Federal Reserve’s decision, market expectations point to a rate cut from 4.00% to 3.75% in the short term. A potential reduction in borrowing costs in the United States creates an environment of greater liquidity, which typically benefits risk assets such as Bitcoin, as capital tends to seek higher returns when interest rates fall.
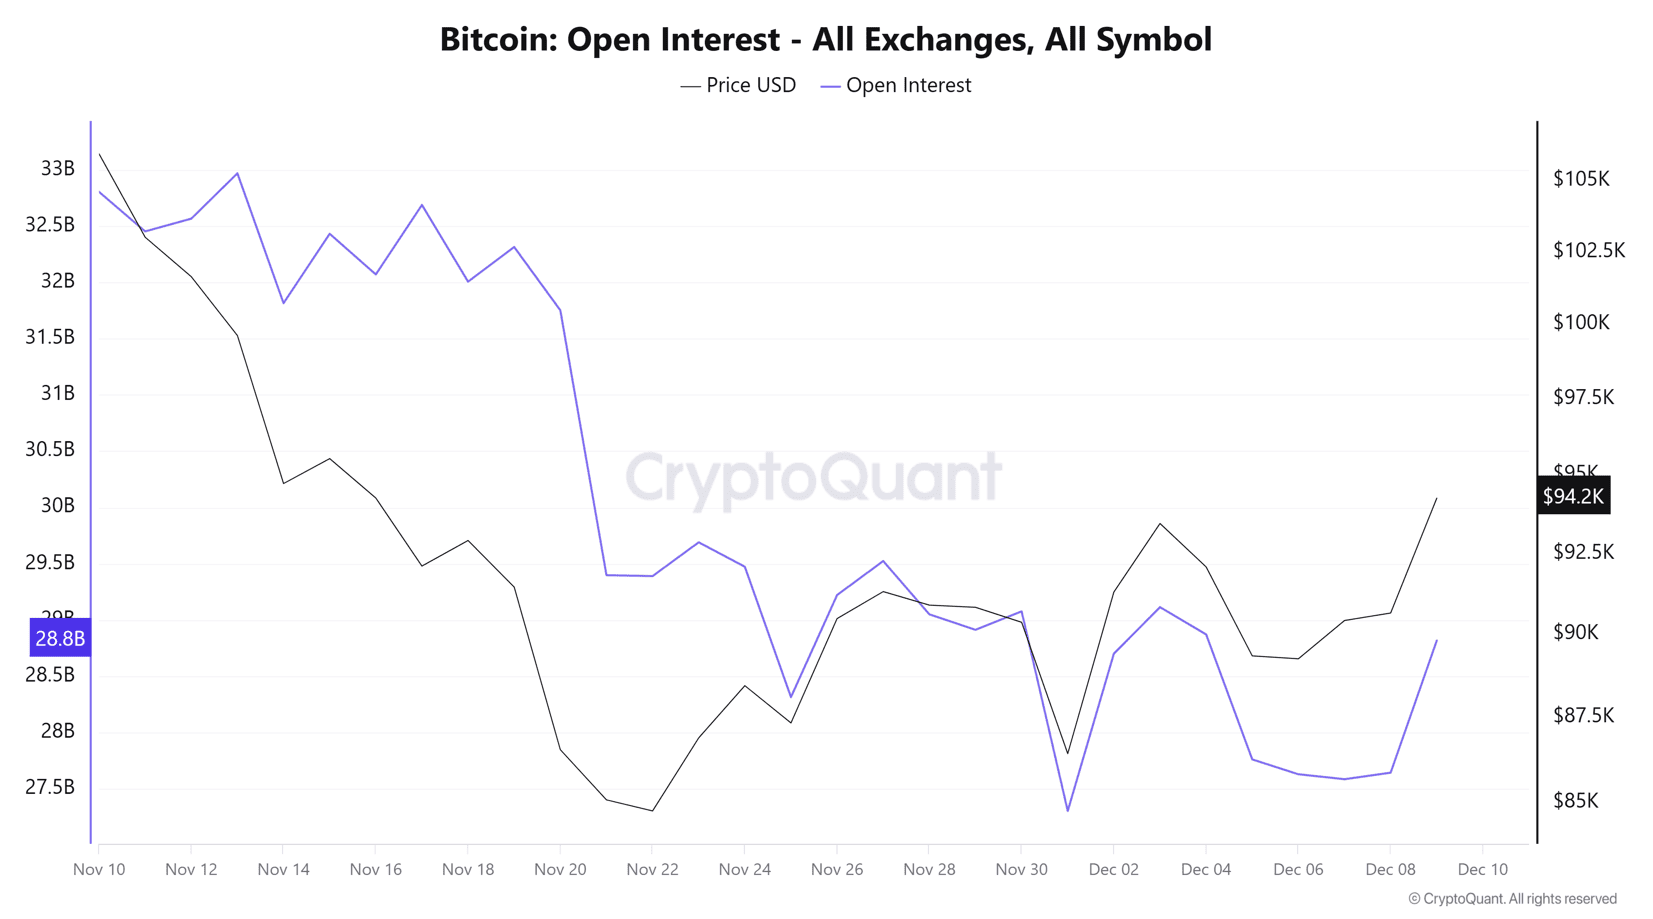
This behavior is reflected in network metrics and Bitcoin-related ETF indicators—particularly Open Interest, which is once again showing steady growth, approaching the 30-billion mark. Since Open Interest measures the total number of open long and short positions in the market, its increase, along with BTC’s price recovery, suggests a renewed inflow of institutional buying, consistent with stronger risk appetite fueled by expectations of lower rates.
Source: Coinmarketcap
Thus, the new environment of lower interest rates seems to be acting as a key catalyst for the return of appetite for Bitcoin. If the Federal Reserve reinforces this outlook with dovish comments tomorrow, institutional interest in BTC may continue to rise, supporting more consistent buying pressure in the short term.
Confidence Attempts to Recover
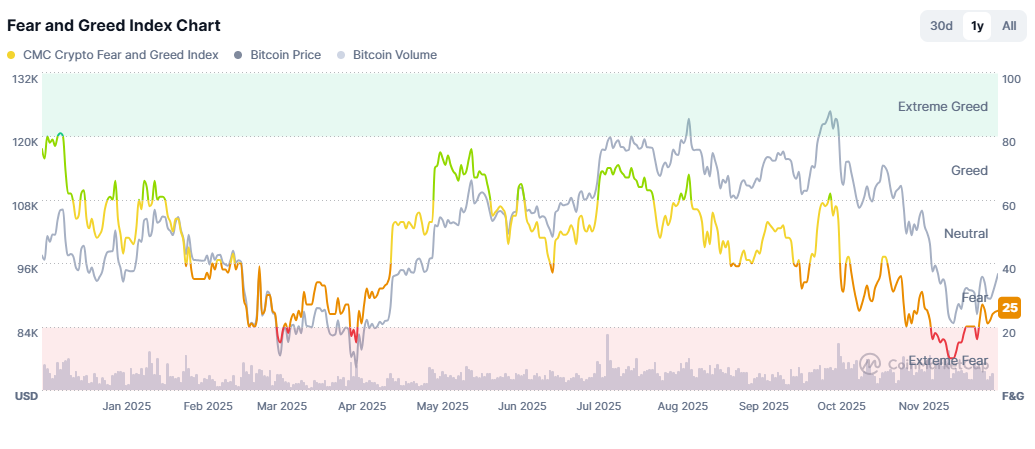
Sentiment in the crypto market has also shown signs of improvement. After spending several weeks in “extreme fear”, the Crypto Fear & Greed Index has rebounded to 25 points, positioning itself in the “fear” zone and maintaining relatively steady readings—evidence that confidence has begun to improve within the cryptocurrency environment.
Source: Coinmarketcap
Although this recovery could support stronger short-term demand for BTC, it is important to note that the indicator is still in negative territory. As long as it does not move closer to the “neutral” zone, there remains a risk that confidence may weaken again, potentially triggering renewed uncertainty if demand fails to hold. This could lead to another wave of pessimism or indecision in the BTC market if confidence indicators do not continue improving over the coming weeks.
Bitcoin Technical Outlook
Source: StoneX, Tradingview
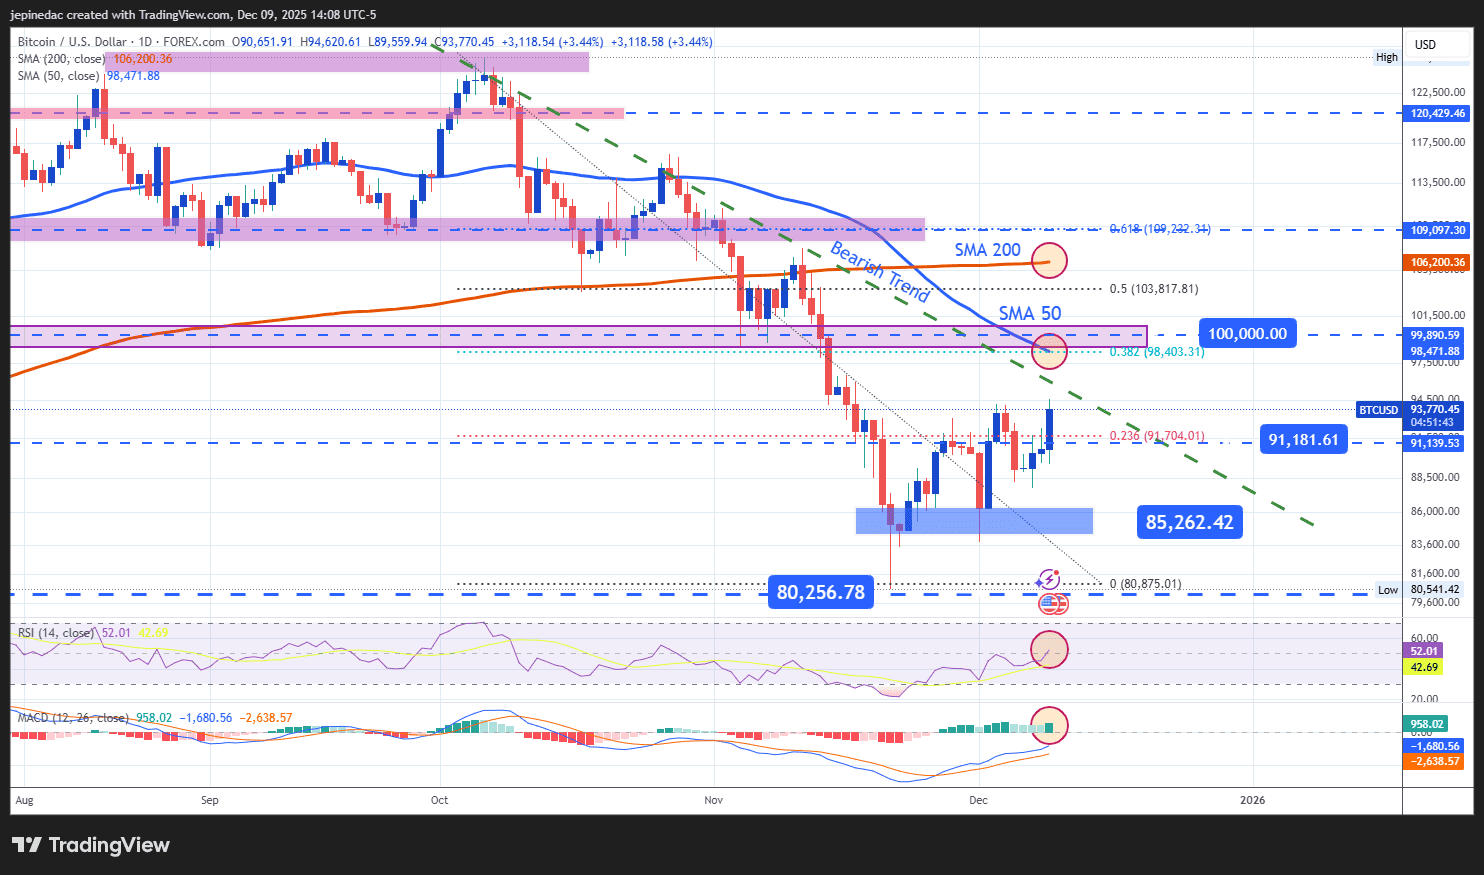
- The Downtrend Still Holds: Despite Bitcoin’s recent bullish momentum, these advances have not yet been enough to break the downward trendline that remains in place from its historical highs above 120,000 USD. Buying pressure has strengthened, but the price still needs to advance further to overcome this structure. Until a solid breakout occurs, the bearish trend may continue to dominate price action in the sessions ahead.
- RSI: The RSI shows an upward slope and has recently crossed above the neutral 50 level, signaling a meaningful shift in momentum and showing that buyers have regained control in the short term. If this trend continues, buying pressure could strengthen further.
- MACD: The MACD is also showing positive signs: its histogram has begun to oscillate consistently above the zero line, confirming that short-term moving-average strength is now tilted toward a bullish bias. If the histogram continues to rise, this could support a solid continuation of upward momentum in the next sessions.
Key Levels:
- 100,000 – Key Resistance: This is the main bullish barrier, aligning with a retracement zone observed in June and the downtrend line, as well as the 38.2% Fibonacci retracement. If buying pressure is strong enough to reach and break this level, it could mark the end of the broader downtrend and activate a dominant bullish bias.
- 91,181 – Nearby Barrier: A short-term support zone aligned with the 23.6% Fibonacci retracement. If prices remain near this level, a period of indecision could develop.
- 85,262 – Final Support: This marks the lowest level within the broader downtrend and represents the most important bearish barrier. A break below this point would reactivate selling momentum and allow the downtrend to continue in the coming weeks.
Written by Julian Pineda, CFA, CMT – Market Analyst
Follow him at: @julianpineda25