
- Strategy sells bitcoin for only the second time in its history
- Saylor's "never sell" message faces an awkward reality check
- BTC/USD breaks trend support, 50DMA, 100DMA and 200DMA
- $65,000 eyed as squeeze risk starts to build
The Signal, Not the Sale
Bitcoin is struggling despite buoyant risk appetite elsewhere. Adding to the discomfort, one of its biggest believers is now selling into the weakness.
Michael Saylor's Strategy offloaded 32 bitcoin between May 26 and May 31, raising around $2.5 million. Against holdings of more than 700,000 coins, the sale was immaterial. However, the message wasn't. For years, Saylor has urged investors to buy bitcoin, hold bitcoin and never sell it. Now Strategy says it may offload bitcoin to improve share metrics, support dividend payments or strengthen its financial position.
The shift is notable given Strategy now increasingly relies on preferred securities and yield-paying products backed by its bitcoin holdings. Strategy is effectively raising capital from investors seeking income and using it to accumulate an asset expected to deliver superior returns over time. It's a strategy that may prove highly successful. But it also muddies what was once a simple proposition: buy bitcoin, hodl bitcoin, never sell it.
Waterfall Decline as Squeeze Risk Builds
Source: TradingView
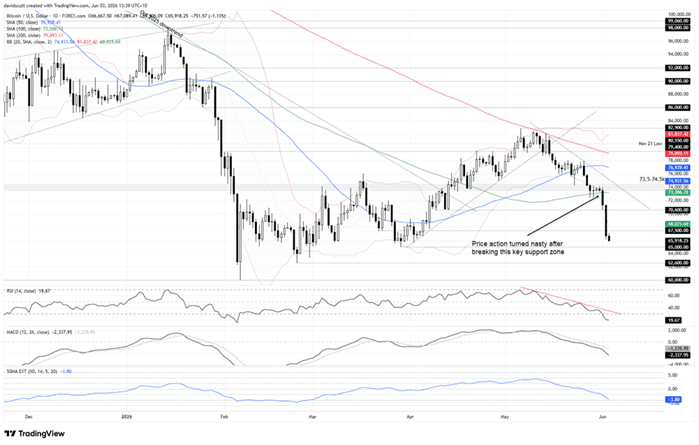
BTC/USD simply looks terrible on the charts, breaking beneath the uptrend it had been trading since late March in May after several failures to clear the 200-day moving average. That eventually saw the price slice through the 50 and 100-day equivalents along with an important support zone between $73,500 and $74,500.
Since the latter gave way, the price has mirrored a waterfall on the daily, with minor supports at $70,600 and $67,500 broken with ease, typical of when you've seen forced liquidations take place. $65,000 is the next downside level of note, coinciding with the swing low set in March. Beyond that, there's little to speak of until the multi-year low near $60,000 set in early February, with $62,600 the only level of note in between.
The message from RSI (14) and MACD shows the bears are in control with downside pressure continuing to strengthen. So fast has the move occurred, both indicators are now encroaching on what are fairly extreme levels even for crypto winters. The stretch indicator shown in the bottom pane is providing a similar message, with the price now trading 3.8 ATR (14) below the 50-day moving average.
While not yet at the levels seen earlier this year, and certainly no guarantee that further weakness won't arrive near-term given the price and oscillator signals, it warns that squeeze risk is building given how stretched the move has become, a point reinforced by the price currently trading beneath the lower Bollinger Band.
If you're getting short around these levels, risk management must rank highly when considering the appropriate reward for doing so. Price action around $65,000 or $67,500, whichever is tested first, may prove instructive on how to proceed, allowing both levels to be incorporated into trade construction.