
For much of last year, USD/CAD was going against the grain. Sure, in early 2025 trade as the USD was dropping aggressively on the back of tariffs, USD/CAD was very much along for the ride. But it was around June when USD-weakness was no longer showing prominently in the pair and that was followed by the build of a bullish backdrop, via an ascending triangle formation, which then led to a breakout and rally in Q3 and then Q4.
USD/CAD Daily Chart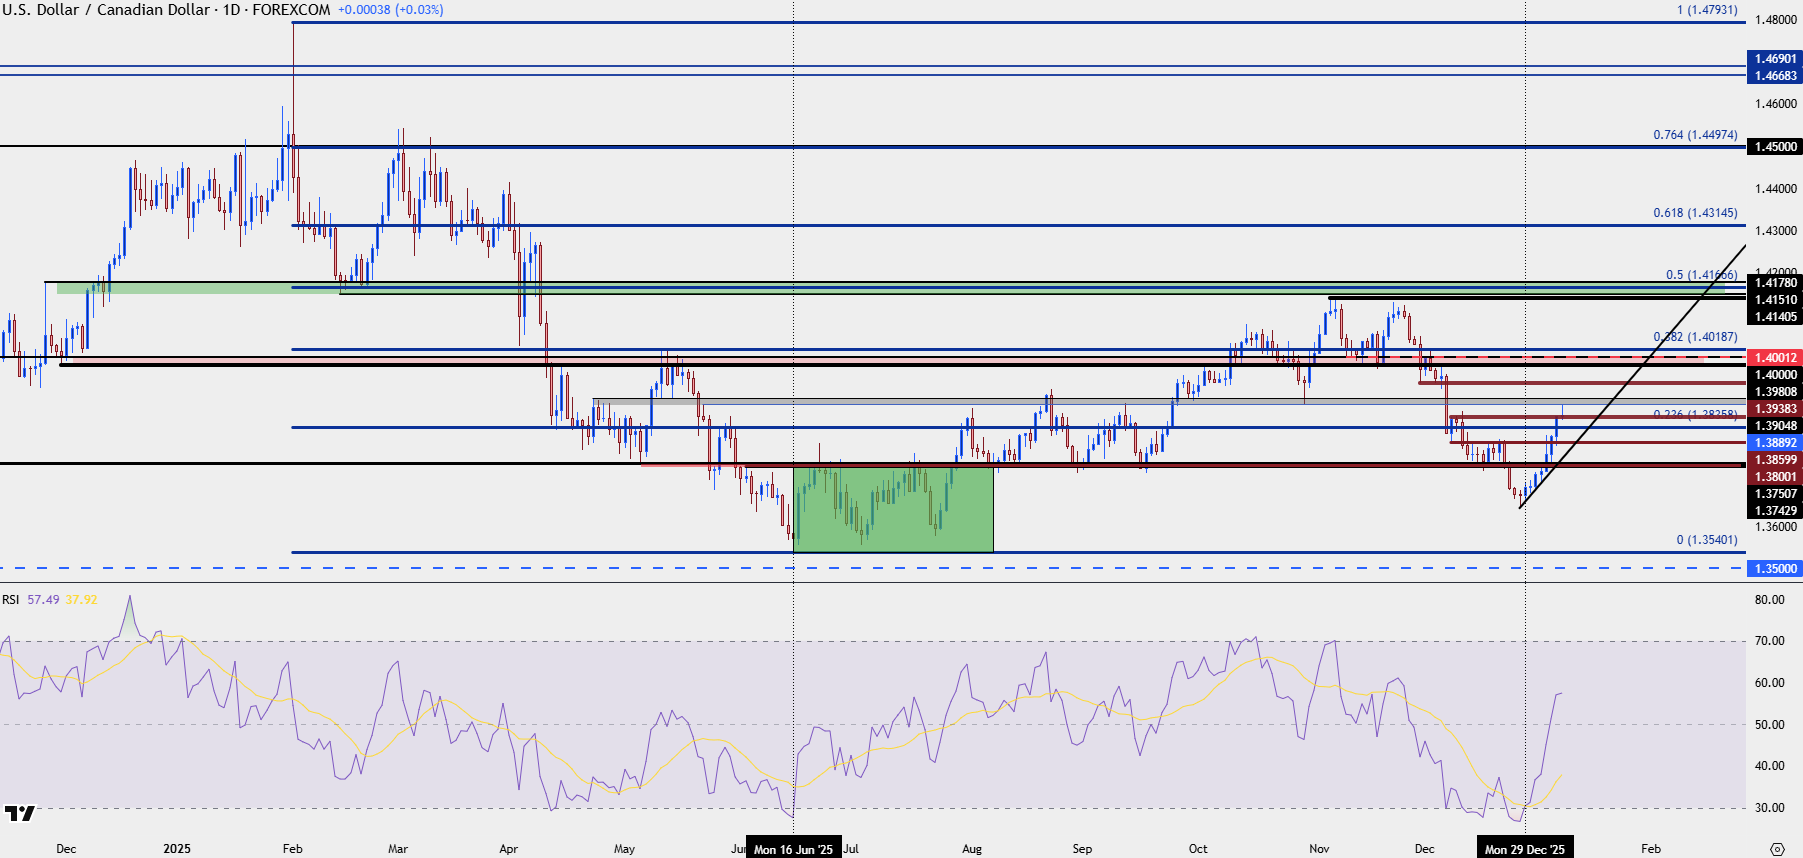
Chart prepared by James Stanley; data derived from Tradingview
What ultimately stopped the bullish trend was the 1.4150 area that was just ten pips away from coming into play. This is a big zone of prior resistance-turned-support, and bulls gave it a couple of shots but came up short both times. And then in December, as USD-weakness took back over, that showed clearly in USD/CAD with the pair dropping below 1.4000 and continuing to drive lower into the Christmas holiday.

But, as highlighted on Monday, a different theme has started to show.
Tomorrow brings jobs numbers from both Canada and the U.S., and this can hasten momentum in the pair although it may not be in a clear fashion right around the data. I’ll explore that in greater detail below.
USD/CAD Four-Hour Chart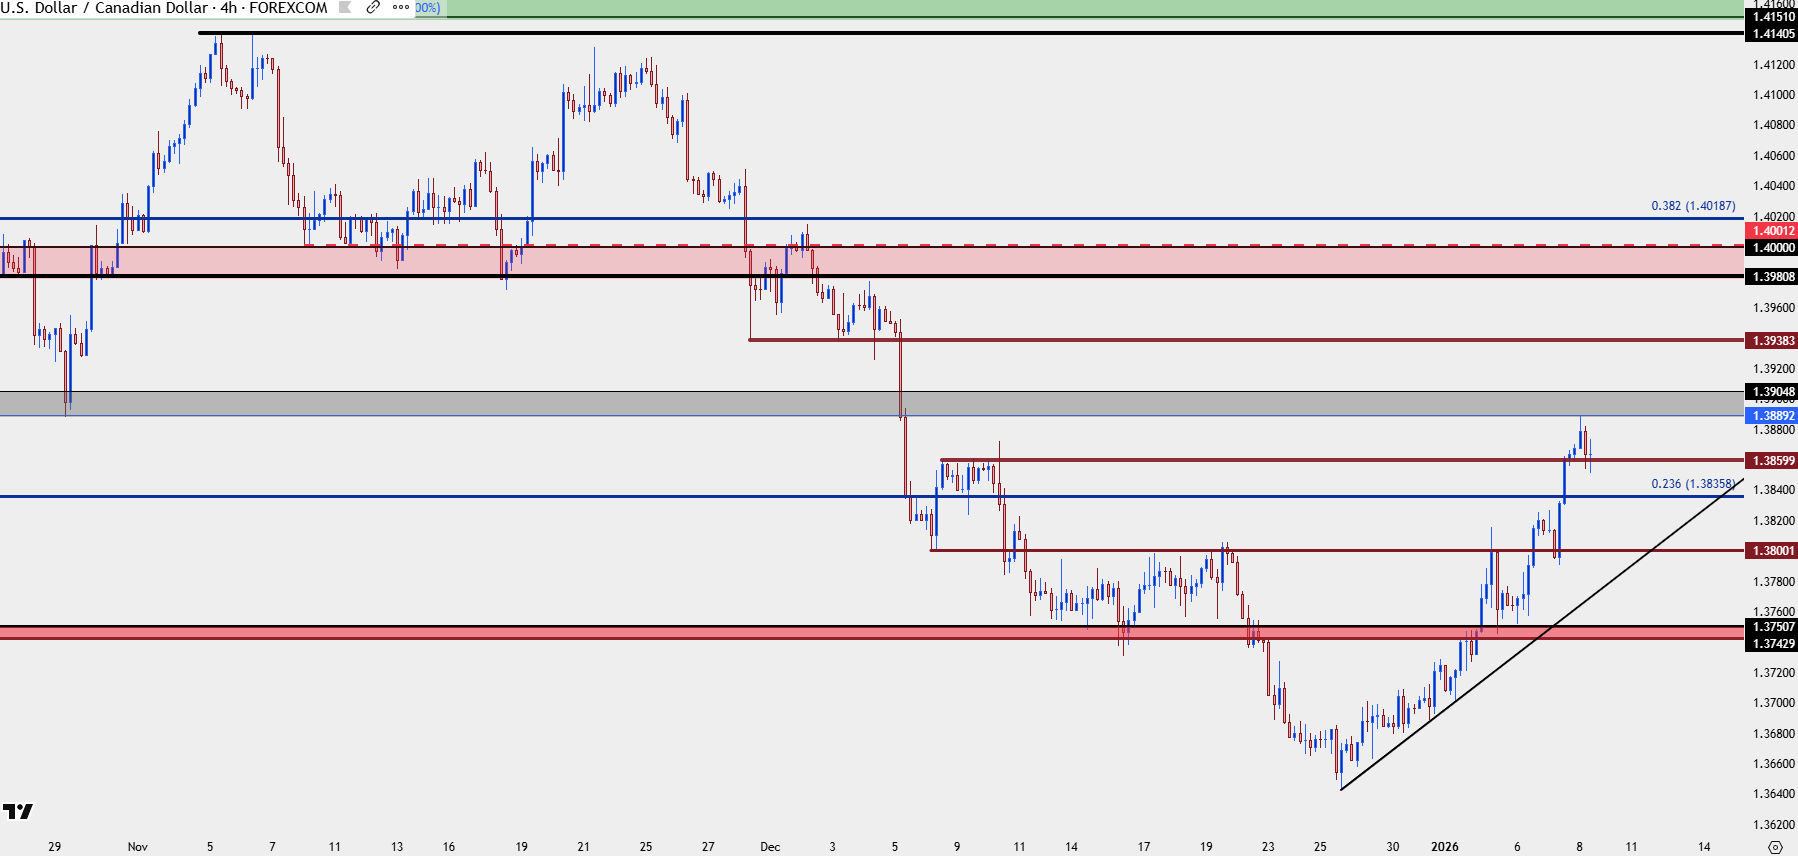
Chart prepared by James Stanley; data derived from Tradingview
Jobs Data Importance
At this point the US Dollar has spent most of early-2026 trade in a counter-trend mode, and USD/CAD has echoed that cleanly. We may be nearing another point where USD/CAD becomes one of the clearer markets to work with USD-strength continuation, although it would still be early to rest on that assumption.
The challenge in USD/CAD at this point is just how quickly strength has come on, and that’s led to an overbought reading on the four-hour chart following the oversold reading on the daily chart just a couple weeks ago.
This is also where that data tomorrow can offer some assistance to trend traders, as a pullback in both USD and USD/CAD can allow for support tests, and in USD/CAD, the structure remains pretty clean given how well price has adhered to prior price action zones.
So far, resistance has held at the 1.3889-1.3905 zone, and the pullback from that has held at 1.3860. But – below are two different price levels of importance at 1.3836 and then 1.3800, both of which can offer the possibility of higher-low supports to allow for bullish continuation. In that scenario, the 1.4000 level becomes an ideal area to look for price to ultimately move towards if we do see buyers continuing to support the market. Before that comes into play, there’s also a swing level at 1.3938 that can act as an ‘r1’ level, of sorts.
For ‘s3’, I’m still tracking the same 1.3750 zone and in this instance, I think that’s a proper area to consider for invalidation of bullish trends, as a closed body break below that price would also come along with a breach of the bullish trendline. In that scenario, I expect that there would be more attractive areas to work with USD-weakness, but if we do see a strong Canadian jobs print, that math can begin to change.
USD/CAD Four-Hour Price Chart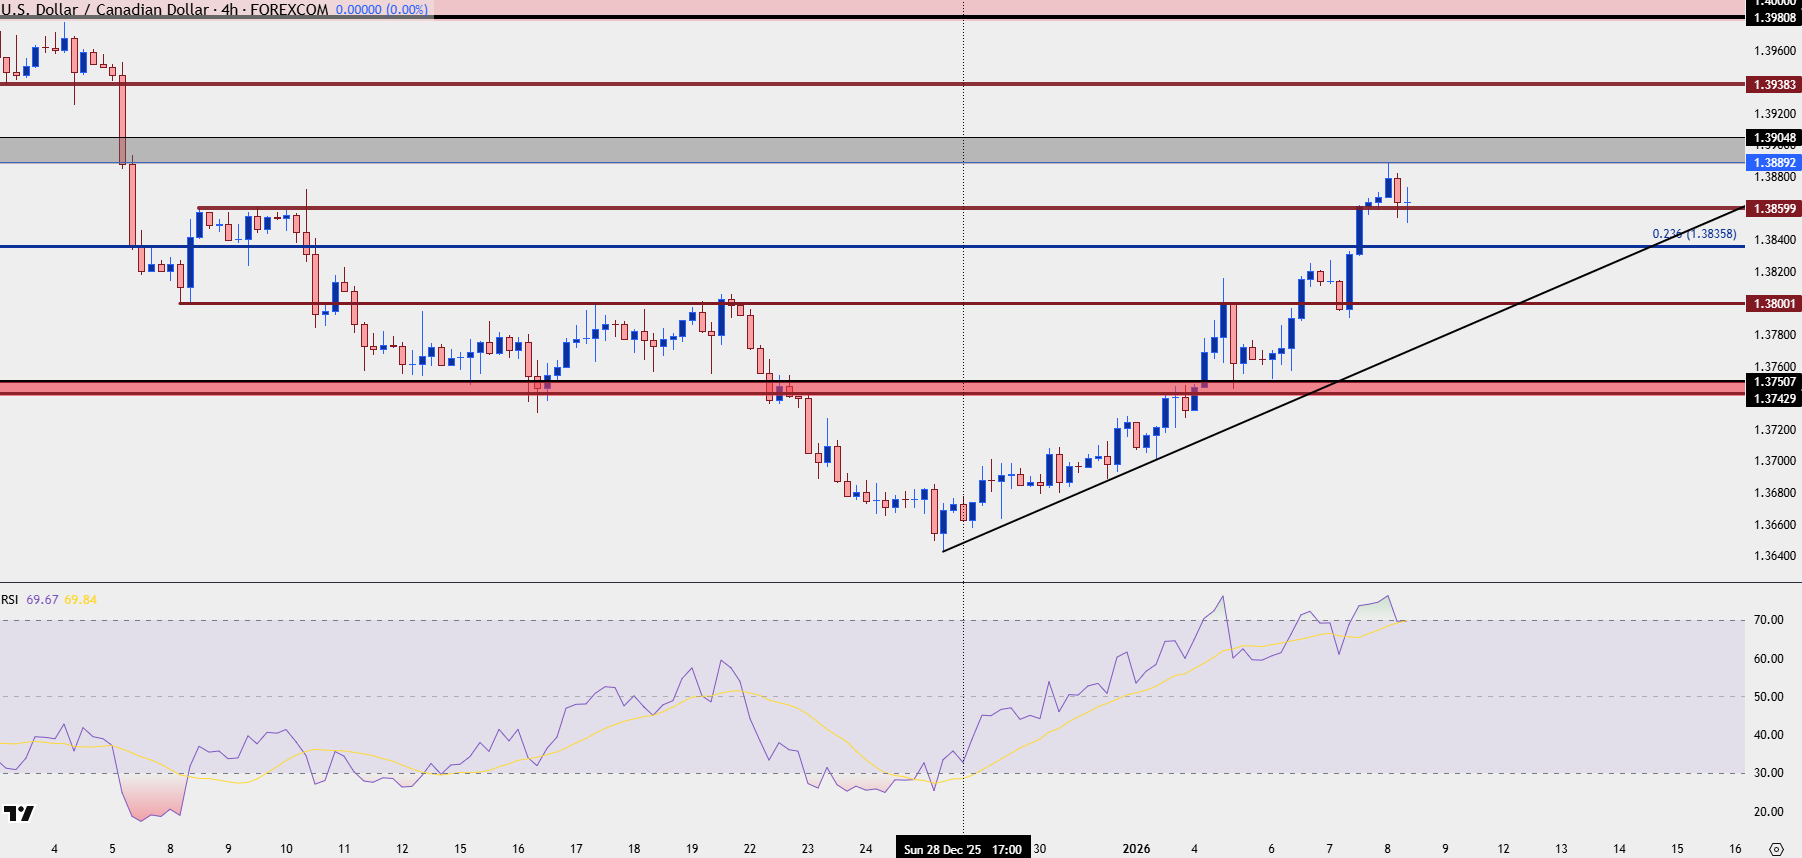
Chart prepared by James Stanley; data derived from Tradingview
--- written by James Stanley, Senior Market Analyst, Global Macro