
The USD/CAD pair has echoed and in many cases exacerbated larger USD trends of late, with the pair pushing up to a fresh high in early-November as DXY threatened a breakout. And that’s around where matters began to shift…

While DXY went on for another re-test of that early-November resistance around the 100-handle in DXY later in the month, USD/CAD set a lower-high, and then the ground began to shake for the pair as prices quickly fell below the 1.4000 handle. Bulls had a last gasp of optimism after that initial 1.4000 re-break, but sellers swatted it down at the big figure, and that led to a decisive sell-off that spanned another 350+ pips, all the way into the six-month low that was established on the Friday before last.
Since then, however, with USD showing some element of strength the USD/CAD pair pushed along with it, leading to this morning’s test of the 1.3800 handle which has so far been defended by sellers.
USD/CAD Daily Chart
Chart prepared by James Stanley; data derived from Tradingview
USD/CAD 1.3750: A Big Spot Re-Emerges
It’s the 1.3750 level that played a large role in the pair’s dynamics in 2025. That price initially set a low in May that led to a bounce up to the 1.4000 handle, which sellers defended aggressively. That then brought a break of the 1.3750 level but through the month of June and July, that price set resistance on multiple occasions as a bullish formation began to build.
The ascending triangle in USD/CAD led the pair to being one of the more attractive venues for USD-strength as we went into Q3 and then Q4, and as USD-strength took over after the Fed started cutting rates in September, USD/CAD very much led the way-higher.
It was the 1.3750 level that held like a brick wall of support over three separate instances of tests through August and September before buyers were ultimately able to prod a rally back above the 1.4000 handle.
USD/CAD Daily Chart
Chart prepared by James Stanley; data derived from Tradingview
USD/CAD: 1.3750 Support Test
It’s still early but so far the failed run at 1.3800 has brought upon a pullback and test of support at the familiar 1.3750 level. For bulls, a hold of this support seems important for topside themes and the rounded bottom pattern that’s shown on the four-hour chart can speak to that, with a break of resistance at 1.3800 opening the door for resistance tests at 1.3836, 1.3860 and then the zone around 1.3900 (1.3889-1.3905).
USD/CAD Four-Hour Chart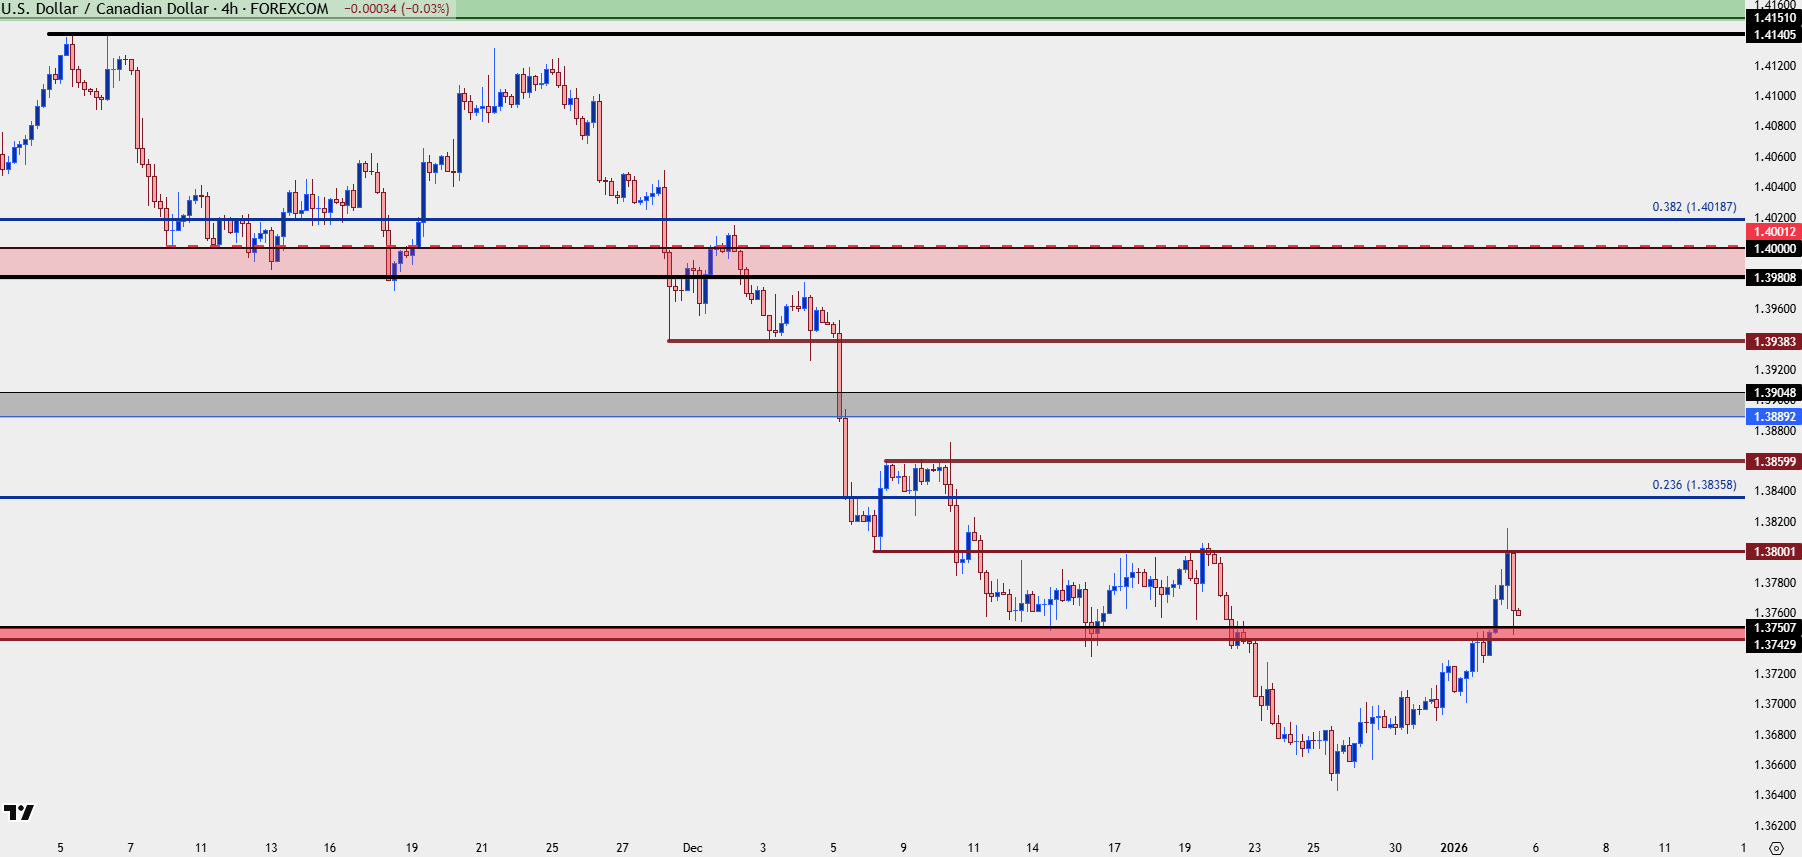
Chart prepared by James Stanley; data derived from Tradingview
USD/CAD For This Year
Longer-term, USD/CAD remains in a range with mean-reversion tendency. There’s a trendline in-play at the moment generated from the 2023 lows so there’s scope for buyers as long as that remains in-place. But, if that gets taken out, 1.3500 and 1.3000 will begin to look attractive under the presumption of the longer-term range continuing.
If President Trump ultimately gets the USD-weakness that he wants, this becomes an attractive scenario to work with.
USD/CAD Monthly Price Chart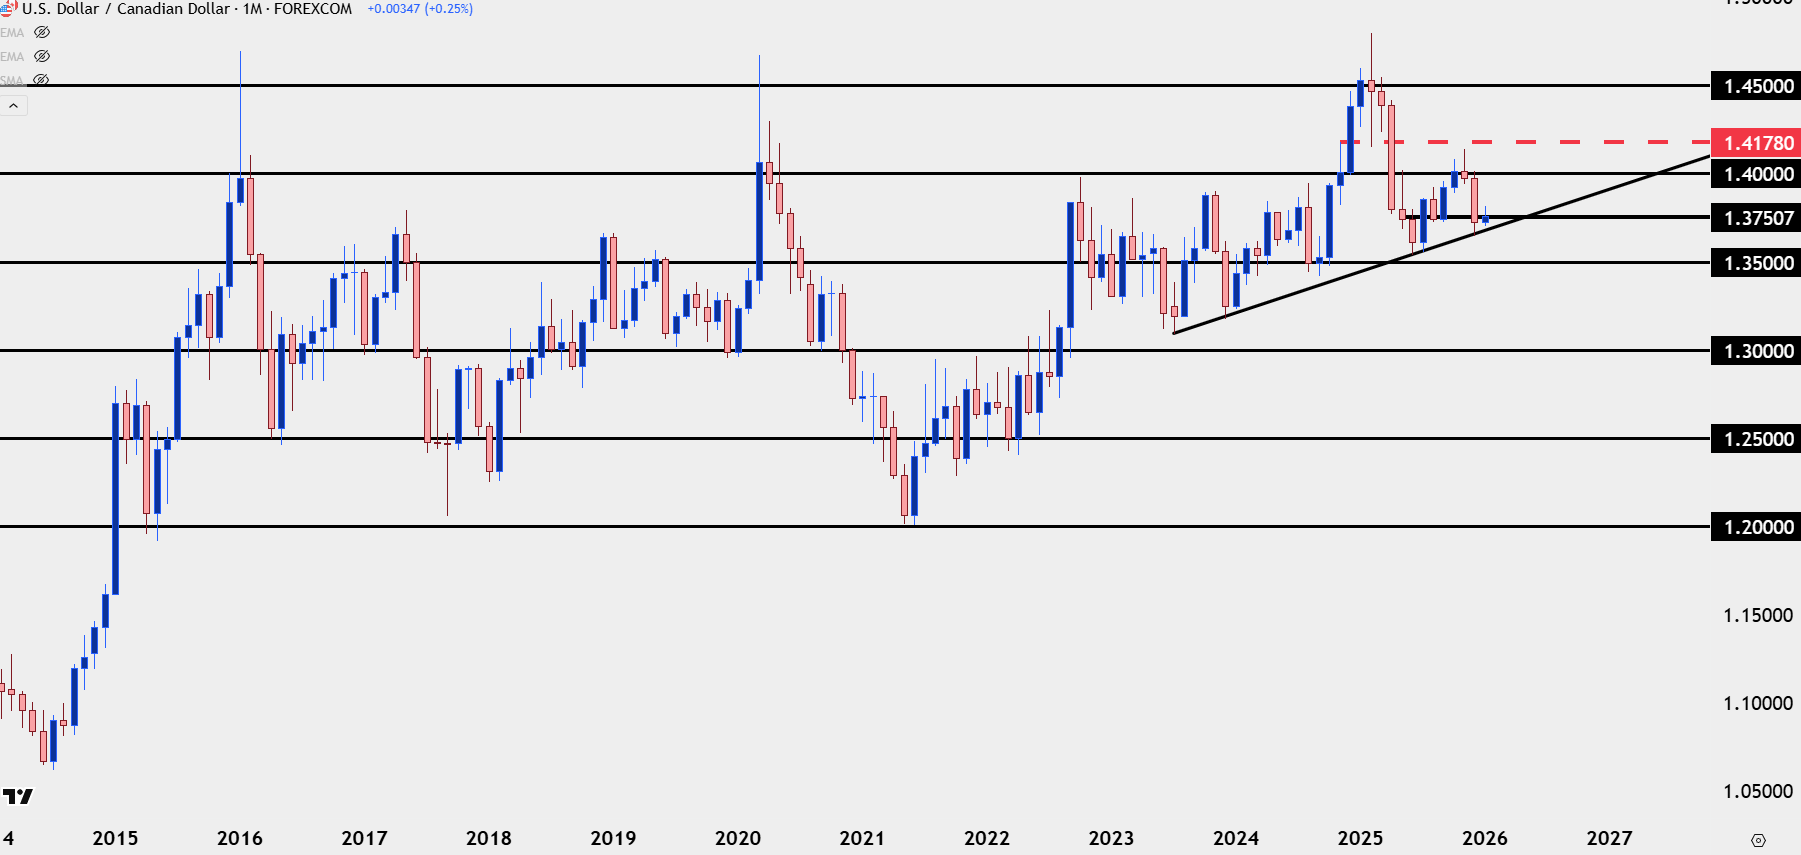
Chart prepared by James Stanley; data derived from Tradingview
--- written by James Stanley, Senior Market Analyst, Global Macro