
The USD/CAD pair has extended a streak of four consecutive bearish sessions, accumulating a decline of more than 1% in favor of the Canadian dollar in the short term, which has begun to consolidate a relevant bearish bias. Downward pressure has remained firm following the release of stronger-than-expected quarterly GDP data, reducing the need for the Bank of Canada to continue cutting interest rates in the near term. This firmer outlook for the Canadian economy has strengthened the Canadian dollar, and as long as the market expects a more restrictive Bank of Canada, this could act as a key catalyst for consistent selling pressure on USD/CAD in the coming sessions.

New GDP Figures Surprise to the Upside
The Canadian economy appears to be gaining more momentum than anticipated. Quarterly GDP data published on November 28 showed growth of 0.6%, well above the previous reading of -0.5%, and on an annualized basis the economy expanded 2.6%, far exceeding the 0.5% expected. These results have shifted expectations for the Bank of Canada, whose decision to maintain low rates had been based on fears of a potential economic slowdown — something the latest GDP data does not currently indicate.
With this new backdrop, the Bank of Canada now has less need to continue lowering rates in the short term. In fact, the recent data points toward stronger economic activity, which could translate into upward inflationary pressures in the medium term. This may lead the central bank to maintain a more neutral stance at the 2.25% policy rate for its final decision of the year on December 10, contrasting with its more dovish behavior in recent months.
This shift is already reflected in market probabilities, which now assign a 94% chance that the current 2.25% rate will remain unchanged in December, signaling a slightly more aggressive Bank of Canada toward year-end.
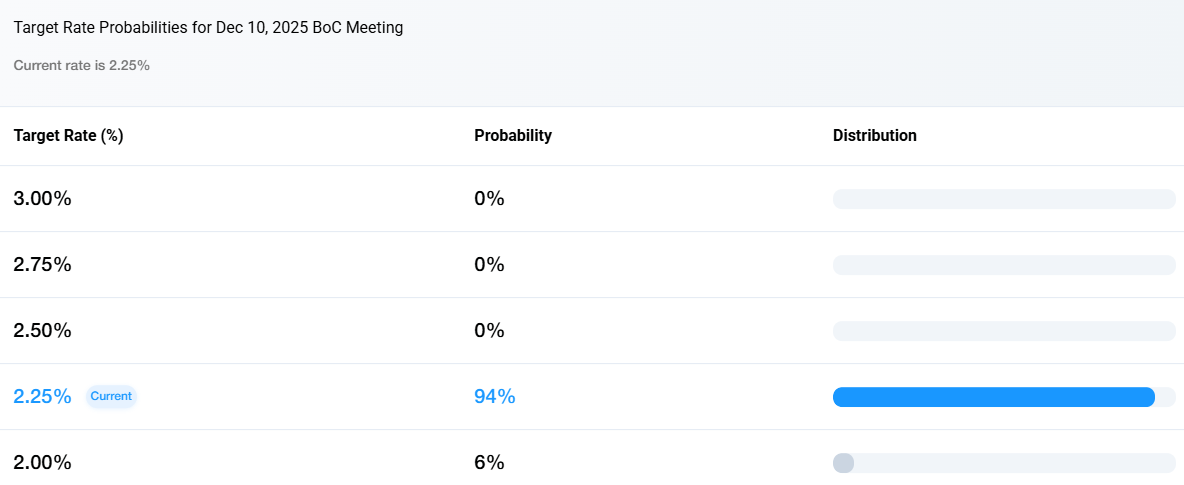
Source: bankofcanadaodds
Meanwhile, in the United States, the market expects the Federal Reserve to maintain a lower-rate policy, with expectations that the current 4.00% rate will fall to 3.75% in the December decision. This difference between a potentially more restrictive Bank of Canada and a more dovish Fed could begin to reduce the relative attractiveness of the U.S. dollar while strengthening Canadian-dollar-denominated investments, especially as the rate differential in favor of the United States continues to narrow. This is already reflected in the behavior of the DXY index, which tracks the strength of the U.S. dollar against other assets and has posted significant declines, now sitting near 99 points, below the psychological 100-point level. This movement confirms persistent short-term dollar weakness and supports the recent advance of the Canadian dollar against its U.S. counterpart.
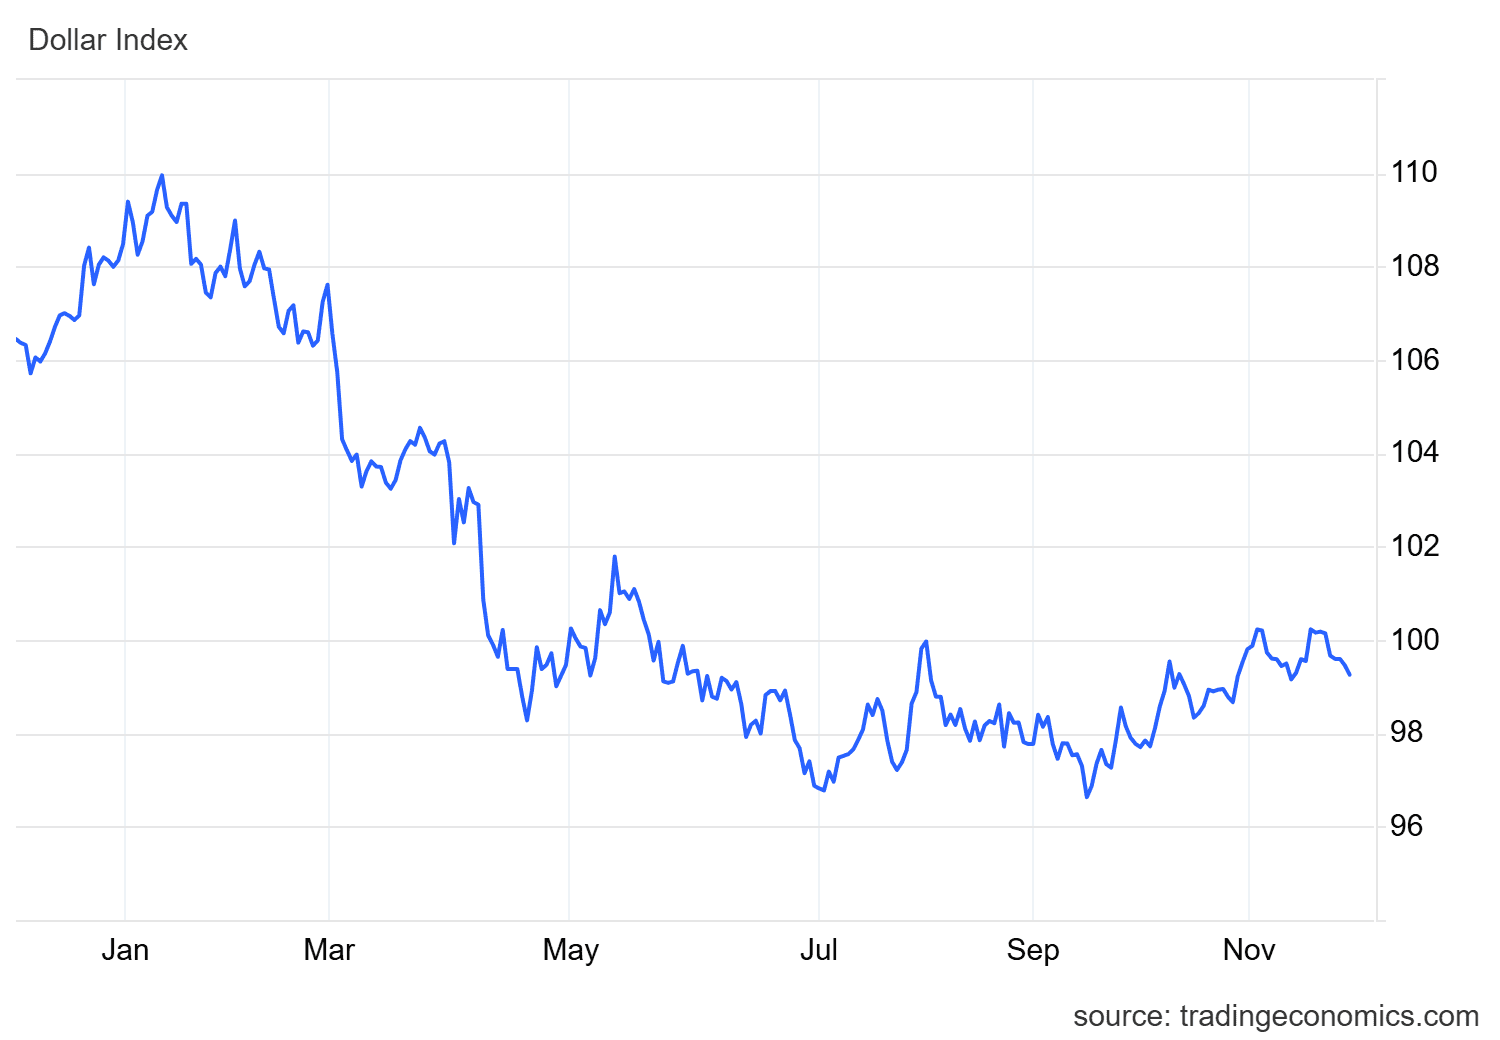
Source: TradingEconomics
In this context, the latest GDP data has played a key role in strengthening the Canadian dollar. If the market continues expecting a more restrictive stance in Canada and a dovish stance in the United States, the Canadian dollar could remain the more attractive currency in the short term. This increases the likelihood that selling pressure on USD/CAD will continue dominating market behavior in the coming sessions.
USD/CAD Technical Outlook

Source: StoneX, Tradingview
- The Uptrend Begins to Weaken: Since mid-July, USD/CAD had been attempting to maintain a consistent upward trendline. However, recent price action has shown notable bearish movement, pulling the pair below the 50-period moving average. If this selling pressure persists, it could result in a break of the ascending trendline, signaling a structural shift in the chart and opening the door to a dominant bearish bias in the short term.
- RSI: The RSI line currently shows a downward slope and consistent movement below the 50 level, suggesting that bearish momentum has dominated over the last 14 sessions. If RSI continues to decline, it could lead to stronger selling pressure on USD/CAD in the coming days.
- MACD: A similar dynamic appears in the MACD, whose histogram remains consistently below the zero line, indicating that bearish strength has held firm across short-term moving averages. This points to a likely continuation of downward pressure in the pair.
Key Levels:
- 1.41174 – Key Resistance: This corresponds to the recent multi-week highs and represents the most important bullish barrier. A move back toward this level could reactivate the upward trendline and generate a temporary bullish bias heading into year-end.
- 1.40017 – Nearby Barrier: A zone of indecision aligned with the 50-period simple moving average and the 38.2% Fibonacci retracement. Continued consolidation around this level could develop into a short-term sideways range.
- 1.39090 – Critical Support: This level aligns with the 200-period simple moving average and represents the most important bearish support. A drop toward this zone could activate a dominant selling bias, end the current uptrend, and initiate a new bearish trend for the coming weeks.
Written by Julian Pineda, CFA, CMT – Market Analyst
Follow him at: @julianpineda25