
Key Events
- Copper holds above 14-year resistance amid tariff risks
- Silver surpasses 2012 highs above $37.50/ounce
- Tech sector in focus amid tariff and production risks
As tariff risks continue to loom over the second half of 2025, import costs tied to tech infrastructure and renewable energy are on the rise—especially after the announcement of a 50% tariff on imported copper, which has sent shockwaves through global supply chains.
With tech and AI innovation embedded in economic agendas worldwide, the demand for suitable infrastructure inputs—particularly silver and copper—is accelerating. These metals are essential for their electrical and thermal conductivity, playing key roles in batteries, electronics, solar panels, and 5G infrastructure, which support clean energy and electrification goals. Copper, in particular, is central to the energy transition and the powering of smart cities, with major applications in power grids, telecommunications, electric vehicles, and data centers.
Beyond production concerns, tariffs may also have inflationary consequences that could weaken the U.S. Dollar, increasing investor appetite for both metals as diversification tools and inflation hedges.
Copper Outlook: Monthly Time Frame – Log Scale
Source: Tradingview
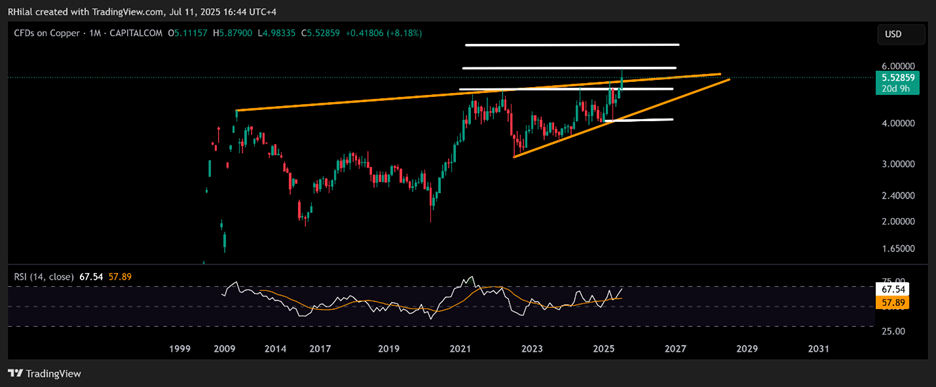
From a monthly time frame perspective, copper has broken above a major resistance zone defined by consecutive highs dating back to 2011. The breakout above $5.40 marks a significant technical milestone. A clean move above the $5.87 high could open the door for further upside, potentially targeting $7.00 and beyond as bullish momentum continues to build.
On the downside, if copper fails to hold this breakout and closes back below the 14-year trendline, support may be retested near the $4.60 and $4.20 levels.
Silver Outlook: Monthly Time Frame – Log Scale
Source: Tradingview
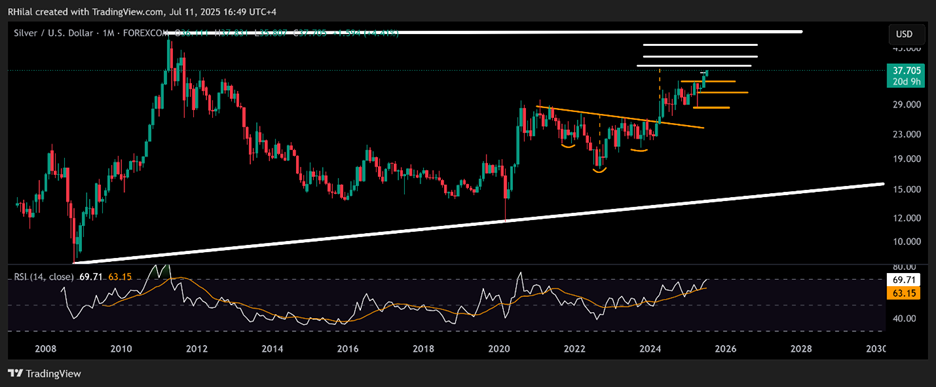
As silver traces new 2025 records, surpassing 2012 highs above 37.50/ounce, it aligns further with the target of the inverted head and shoulders pattern that has extended on the chart between 2020 and 2024, within the 38–39 price zone. This aligns with overbought momentum from the perspective of the monthly RSI, at levels last seen in 2020, strengthening the case for a potential pullback to recharge momentum—possibly back toward levels 35, or 32 and 29 in a steeper scenario. Should the price trend hold above the 39-price zone, further gains can be forecasted toward 42, 46, and eventually the 50 high, in line with tech advancement.
Written by Razan Hilal, CMT
Follow on X: @RH_waves