

GBP/USD steadies at 1.32 as USD bulls pause after mixed jobs data
GBP/USD is finding support around the 1.3200 level after falling almost 2% over the past five days.
The pair is finding some support as U.S. dollar bulls pause for breath and investors digest a mixed UK employment report.
Data from the ILO showed that the unemployment rate unexpectedly declined to 4.6% in the three months to September, below expectations of 4.7%. Employment change also rose to 156,000 from 102,000 in the previous month.
However, these upbeat figures have been offset by a 4.5% rise in the claimant count in October, an increase from 4.4% in September. The number of payroll employees fell by 34,000 in October. Wage growth was also subdued, slowing to 3.5% from 3.7%. This was below the 3.6% reading expected.
The data suggests that the job market remains robust enough to keep another interest rate hike in play at the Bank of England's December meeting.
Attention will now turn to tomorrow's inflation data, which is expected to show CPI rising to 3.7% year on year in October, up from 3.5%. The Bank of England forecasts that inflation will continue rising to almost 5% in Q2 2027.
With inflation expected to climb substantially in the months ahead, recent strength in the labour market makes it harder to dismiss the risk of second-round effects and strengthens the case for another rate hike.
Meanwhile, the U.S. dollar is showing strength, trading around a fresh 19-month high amid hotter-than-expected U.S. inflation last week and hawkish Fed commentary.
U.S. retail sales today and the FOMC minutes tomorrow will provide further clues about the outlook.
GBP/USD forecast – technical analysis
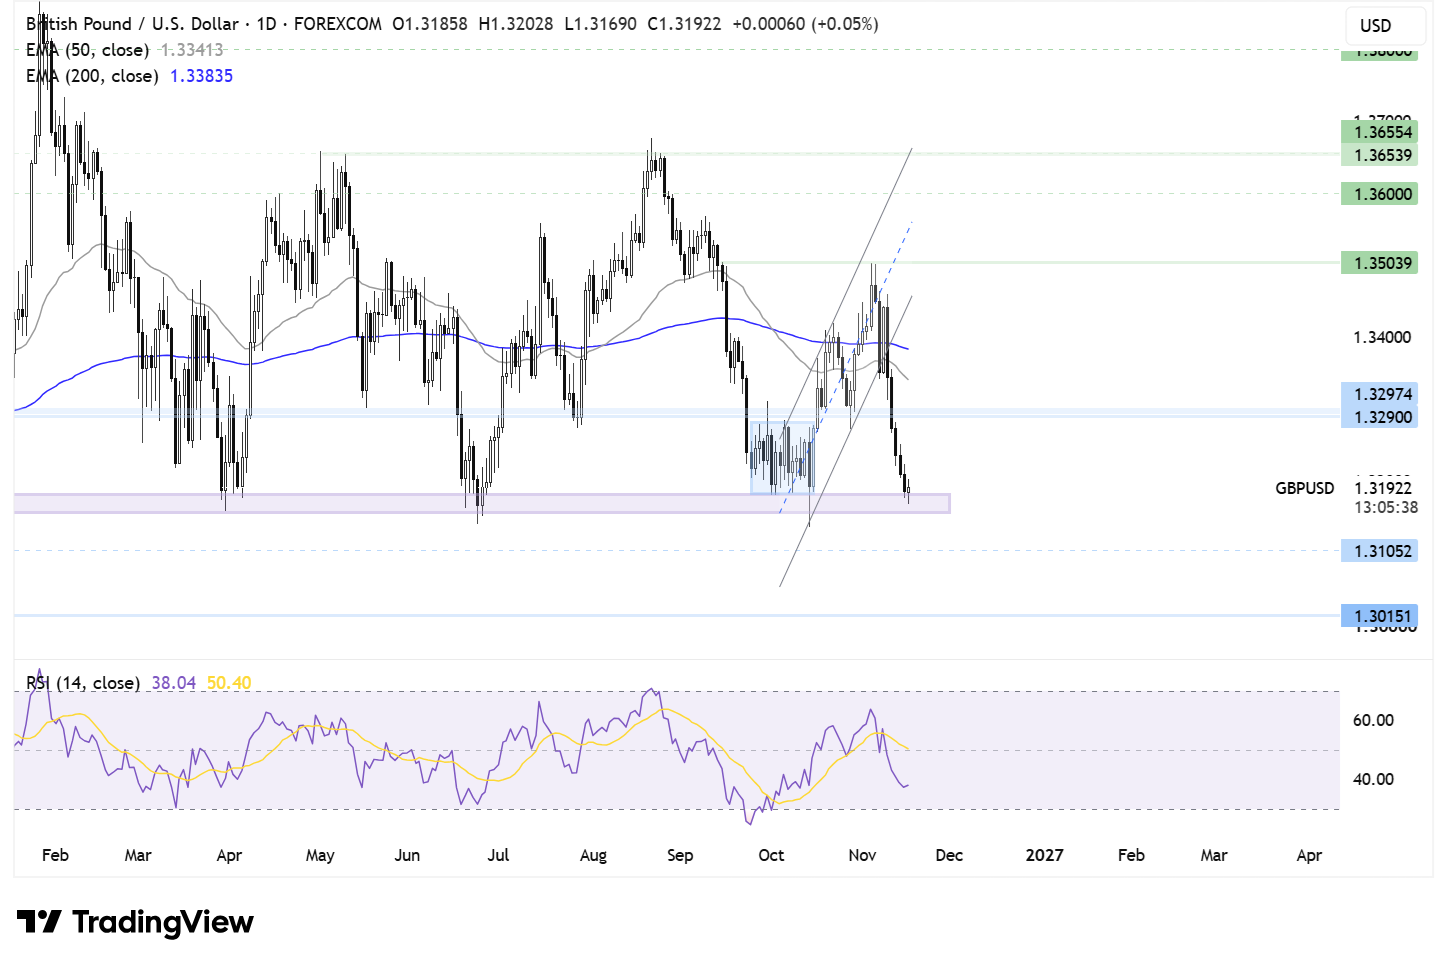
GBP/USD ran into resistance at 1.3500 and rebounded lower, breaking out below the rising channel. The 50 and 200 EMAs are dropping towards the 1.3200 support zone, a key area which has limited losses on numerous occasions over the past year.
Should sellers break below this support zone, this would open the door to 1.3100 and then 1.3050, the November 2025 low.
On the upside, should the 1.3200 support hold, buyers will look to rise above the resistance zone at 1.3300. A rise above here exposes the 50 EMA at 1.3345 and the 200 EMA at 1.3390. Above this level, the price would be on firmer footing.
EUR/USD falls to 1.10 on rising Fed rate hike expectations.
EUR/USD has fallen to 1.1000, its lowest level since April 2025, amid U.S. dollar strength and rising Fed-ECB divergence.
The U.S. dollar has risen to a fresh 19-month high against its major peers this week, supported by expectations that the Federal Reserve will be forced to accelerate its monetary policy tightening cycle, owing to elevated U.S. inflation and a solid U.S. economic outlook.
Recent commentary from Federal Reserve officials has been hawkish, with Christopher Waller bringing the prospect of a 50-basis-point rate hike to the table.
Attention will be on U.S. retail sales and the FOMC meeting minutes today and tomorrow for further clues on the pace of rate hikes by the Fed.
The market is pricing in three more rate hikes between now and June 2027.
This contrasts with the ECB, which is expected to hike rates again in December, although this could be the last hike in the cycle.
While inflation in the eurozone came in at 4% year on year in October, up from 3.8%, energy prices were up 20% compared with a year earlier. Still, Brent has fallen sharply in recent weeks, and if cheaper oil persists, it could ease Europe's energy import bill, reducing inflationary pressures further.
On the data front, the euro will look towards German ZEW economic sentiment, which is expected to improve from 28.1 in October to 29. However, this may do little to support the euro against recent USD strength.
EUR/USD forecast – technical analysis
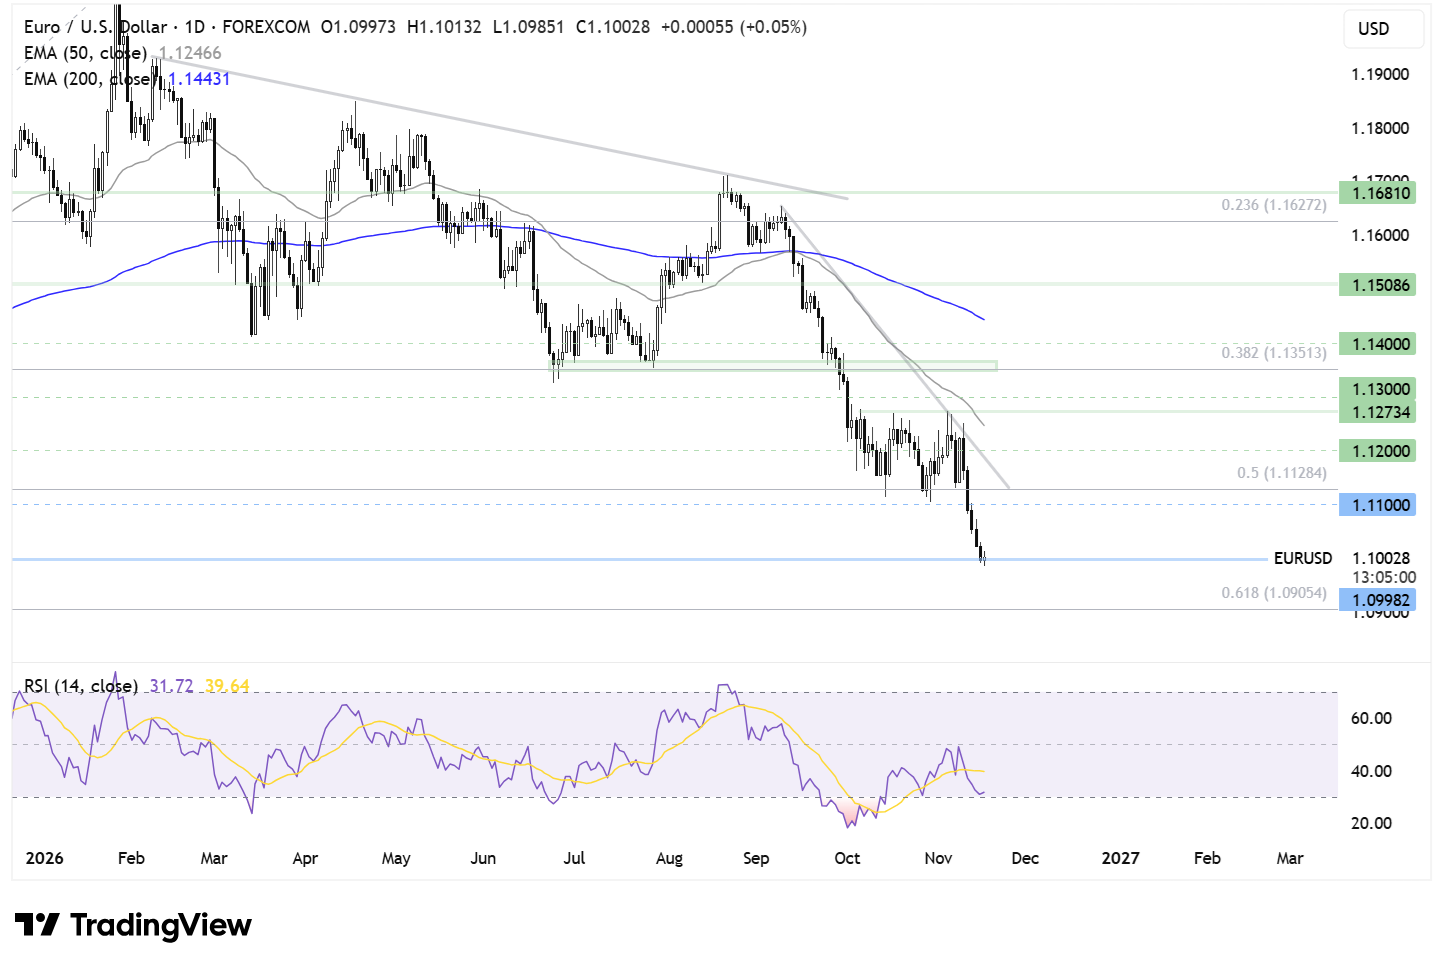
EUR/USD has fallen to 1.1000, a 19-month low. The pair is trading below both its 50 and 200 EMAs, and its falling trend line, keeping the technical picture firmly bearish. The RSI is hovering just above 30, with the pair approaching oversold territory.
On the downside, sellers will look for a sustained break below 1.1000 to bring 1.0885 into focus, the 61.8% Fibonacci retracement of the move from 1.0175 to 1.2080. Below here, attention would turn to 1.0570, the 78.6% Fibonacci retracement level.
Any recovery needs to rise above 1.1100, the 50% Fibonacci retracement, as well as the falling trend line resistance. A break above this area would open the door towards 1.1250, where the 50 EMA and late-October high provide additional resistance. A move above this level would establish a higher high, bringing the 1.1325 resistance zone into focus. This coincides with the 38.2% Fibonacci retracement and previously acted as support in June and July.