It was just two years ago that the massive drive behind the long side of gold began. I tell this story often because to me it was such a big deal, and it’s also something that has relevance in stocks and currencies and several other asset classes. But the story is perhaps clearest in gold.
If we go back to late 2023 gold prices had been resisting at the $2k psychological level for more than three years. Even with the backdrop of Covid-fueled liquidity, gold was unable to leave the $2k level behind, and there were multiple tests there in the three years that followed an each time sellers came in and pushed prices right back below the $2,000/oz level.
But as the focus began to shift towards possible rate cuts in 2024, gold began to find short-term support at that level in late-2023. As we came into that New Year with an election on the radar for later in the year, gold was holding that price as support through multiple tests.
Until the CPI report released in February, that is, as a theme that had been harping on market participants got more life as US CPI came out above expectations. This brought question to whether the Fed would actually be able to cut rates later in the year and this was something the Fed had been pushing even as they were hiking rates, trying to assure market participants that they would loosen policy as soon as they could. This is what helped to catapult stock prices in late-2022, with the help of ChatGPT and the AI trade, and ultimately that was starting to come into question as it was apparent that inflation wasn’t cooperating with the Fed’s plans.
This was on February 13th of 2024 and that was the first day of the year that gold closed below the $2k/oz level. That went along with a strong rally in the US Dollar and a sell-off in stocks, and worry was permeating the horizon as markets had that very real question as to whether inflation was actually tamed or not.
A day later a reprieve arrived in the form of a television interview from Chicago Fed President Austan Goolsbee. Goolsbee is a widely-watched Fed member and had a role in President Obama’s administration, so when he speaks markets take notice. As a small bit of panic had started to show Goolsbee implored markets not to get ‘flipped out’ about a single inflation print.
The thing is it wasn’t a single print – inflation had remained above target for the prior few months and the market’s worry wasn’t based on just one single print, it was the culmination of a theme that brought question to what the Fed had been pushing for more than a year. This comment showed a Federal Reserve that was willing and perhaps even wanting to cut even though inflation had remained high. And the prospect of that is even higher inflation down-the-road which was evidenced later in the year when Treasuries sold off as the Fed began to loosen.
But – that comment helped to slow the panic in February and prices quickly reversed from their CPI-fueled worries. Gold rallied above $2k the next day and never closed below it again. The Dollar pulled back and stocks recovered, but it was the rally in gold that was most pronounced as the metal just continued to jump to fresh all-time-highs.
Gold Daily Price Chart (Sept 2023 – Jan 2025)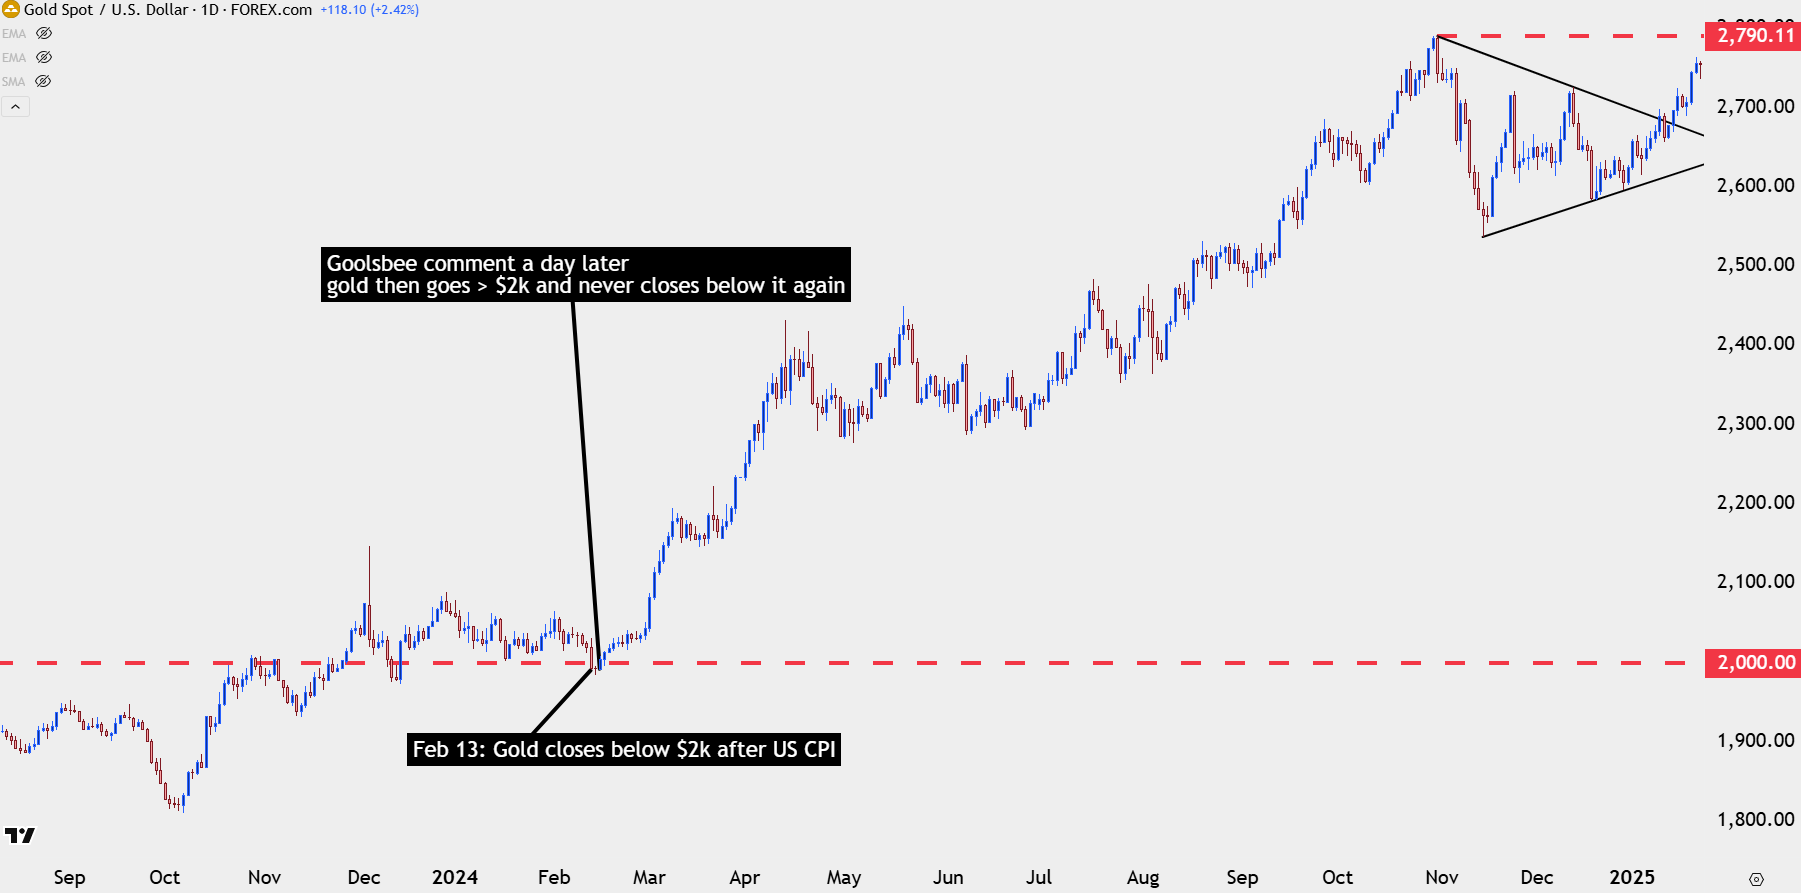
Chart prepared by James Stanley; data derived from Tradingview
Gold Since Then
A historic rally developed in gold that largely continues today. Along the way there’s been a few different periods of digestion with each taking on the form of a symmetrical triangle that represents a bull pennant and there’s often been a FOMC or rates component behind the breakout from each.
Last August’s breakout is great example of that as gold had rallied up to $3500/oz in April and then consolidated for four months. But it was Jerome Powell’s speech at Jackson Hole that triggered the break and that move pushed prices into the final two months of last year.
Gold Weekly Price Chart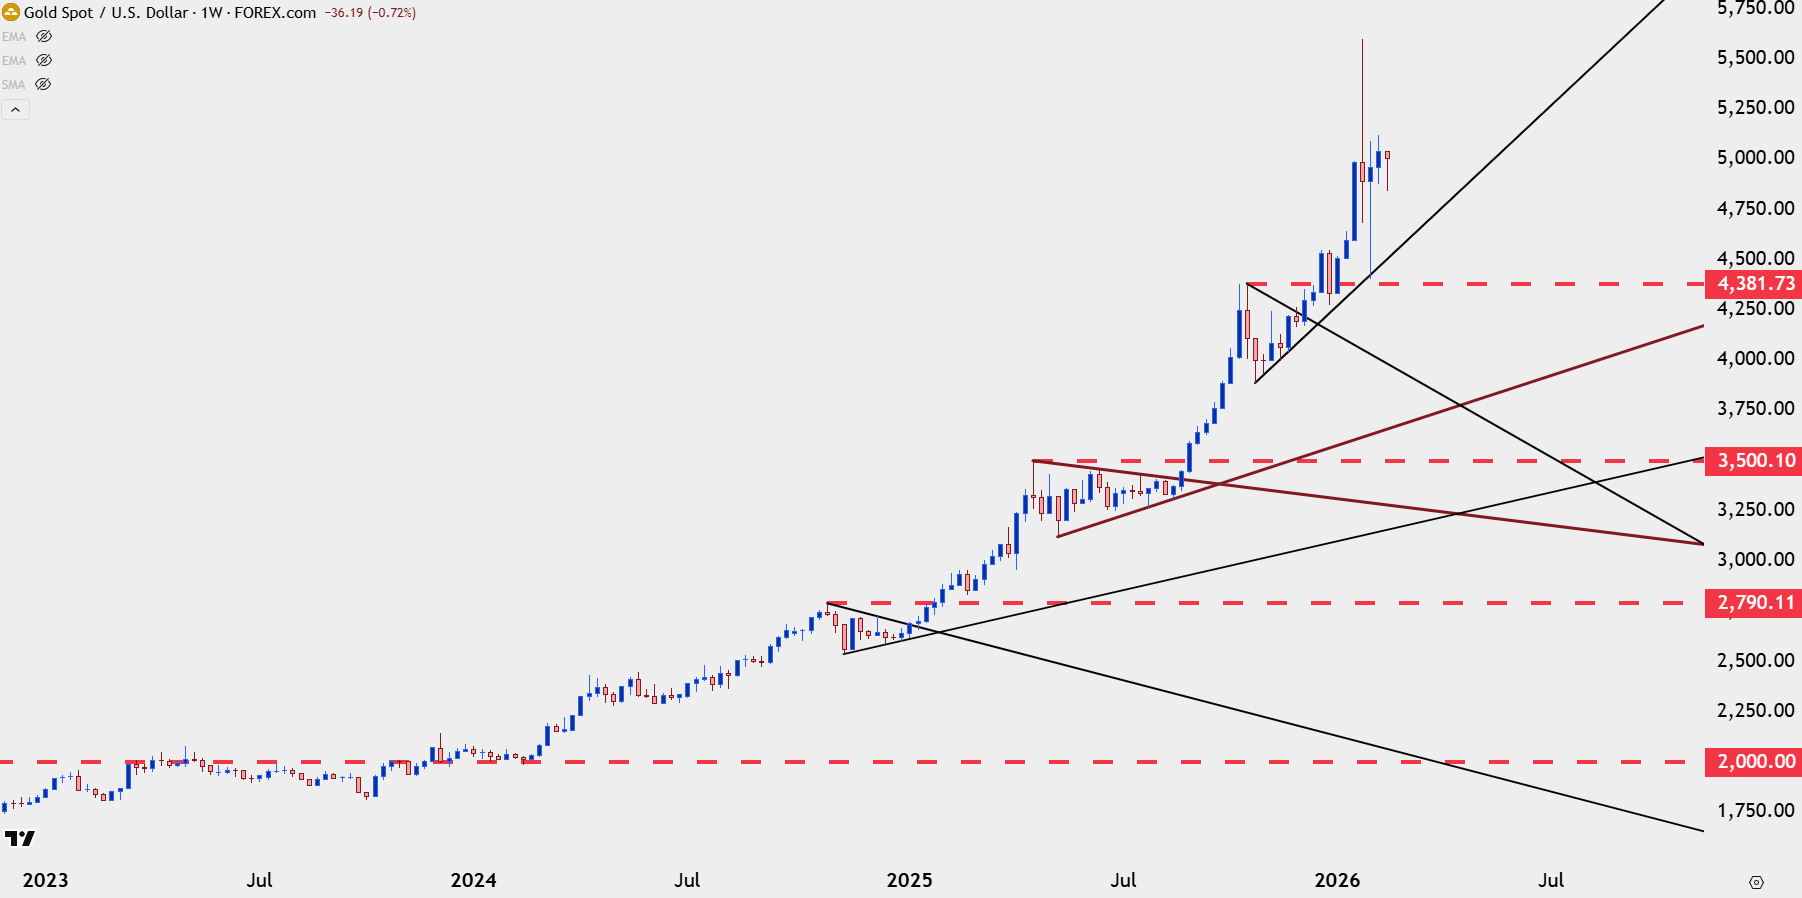
Chart prepared by James Stanley; data derived from Tradingview
Gold Structure
From the above chart you’ll probably notice a cadence of breakout, consolidation, breakout, consolidation and it appears that we’ve entered yet another period of consolidation. I talked about this in yesterday’s webinar and there’s still rationale for holding with a bullish bias although timing the breakout from those consolidation formations is just as unpredictable as any other price move. So, like I had looked at back in August, traders can look to bias the broader trend and if a breakout does take hold, then the trader can adapt both trade management and additional entries.
Last week in the webinar we had a $5k test and that was a big deal as that price level had started to show as short-term support, that led to a rally up to $5100 before sellers ultimately took back over, leading to a deeper dip.
In this week’s webinar, there was another illustration of that and this time it was support at $4856, which has since held as support and set up for another test of the psychological level at the $5k handle.
Gold Four-Hour Chart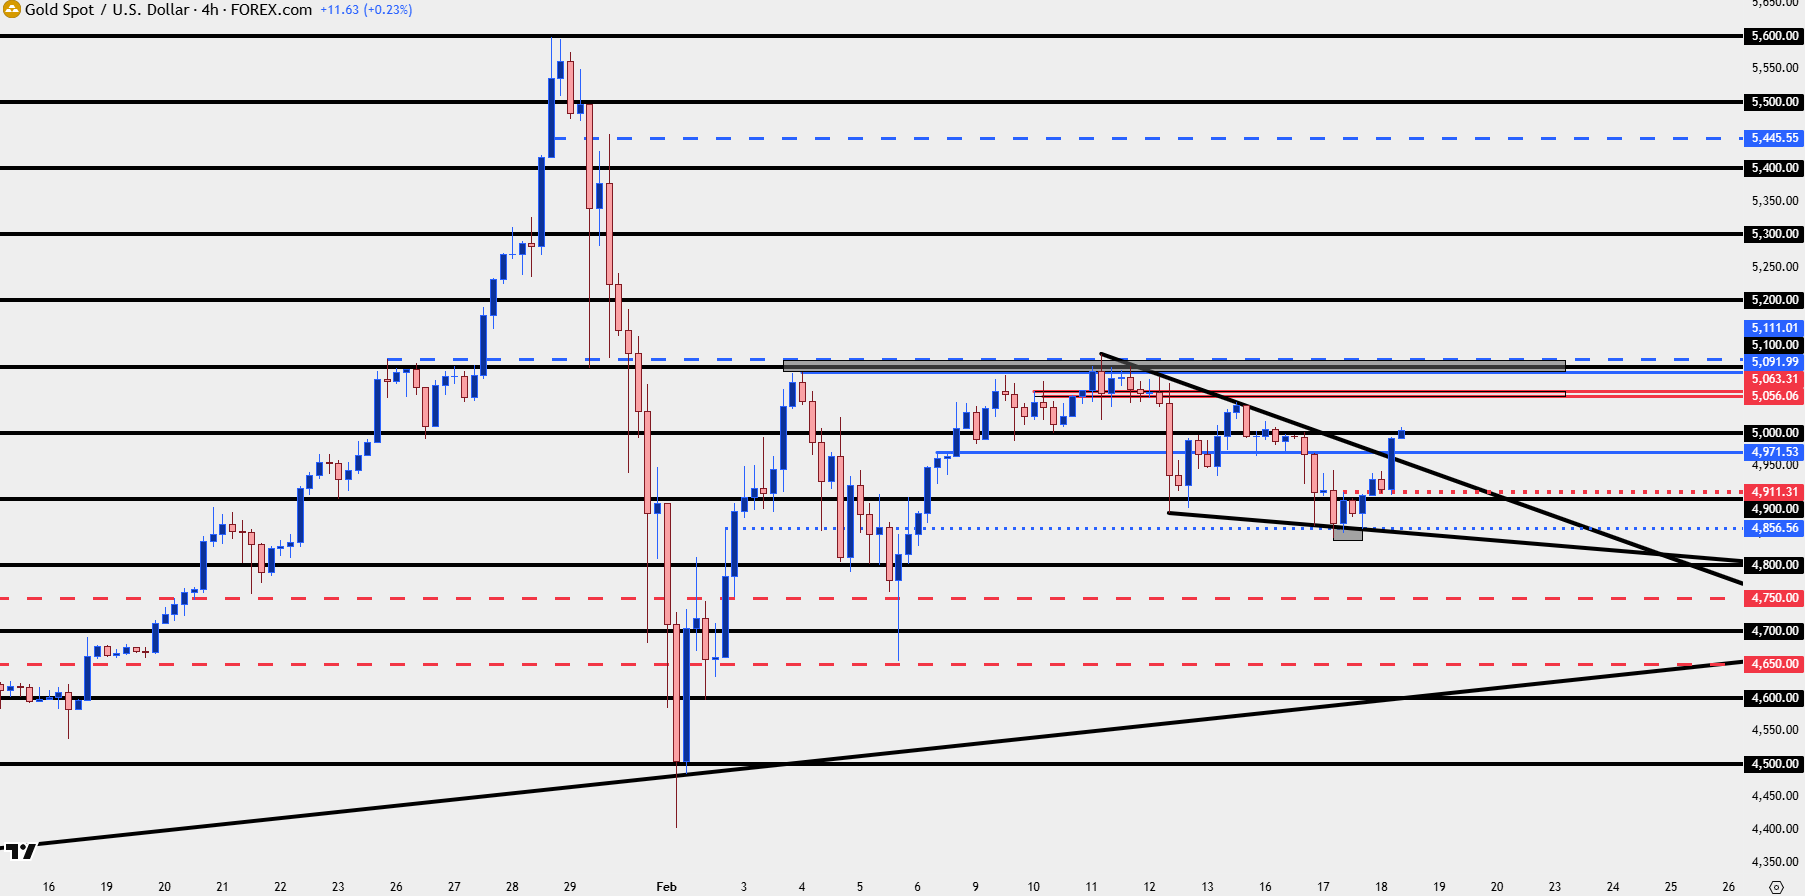
Chart prepared by James Stanley; data derived from Tradingview
Gold $5k
With a move such as we’ve seen in gold it should be obvious that the trend isn’t solely driven by technical traders and short-term strategies. These are the types of themes that are often driven by major market players like central banks and hedge funds and pension funds, and those types of market participants aren’t often as price sensitive as a short-term trader taking on a leveraged position.
But – as we saw back in 2020 those types of market players will often be observant of major psychological levels as a push above the $2k level can make the market ‘feel’ more expensive until, eventually, sentiment shifts to the point where it starts to feel cheap.
Of course the fundamental backdrop will remain a part of that equation as we can see back in 2024, with Austan Goolsbee talking up rate cuts even as inflation remained high, markets adapted and gold below $2k suddenly felt cheap.
This is not only illustration of ‘acceptance’ of the $5k level but also the reason that I think a bullish bias remains in-place as both monetary and fiscal policy in the United States seem to be squarely focused on driving growth even if inflation remains above the Fed’s 2% target.
For now, we have a bullish breakout from a falling wedge formation and bulls have an open door to make a push. There’s now possible support at $4971 with $4900-$4911 below that. If bulls can’t hold prices above that level the short-term trend comes into question and that sets up key support at that same $4856 level that’s already been well-tested.
For next resistance, there’s a prior price zone from $5056-$5063 after which the $5100 level is the next psychological level awaiting acceptance from market participants, as that zone has clearly been resistance multiple times already.
Gold Two-Hour Price Chart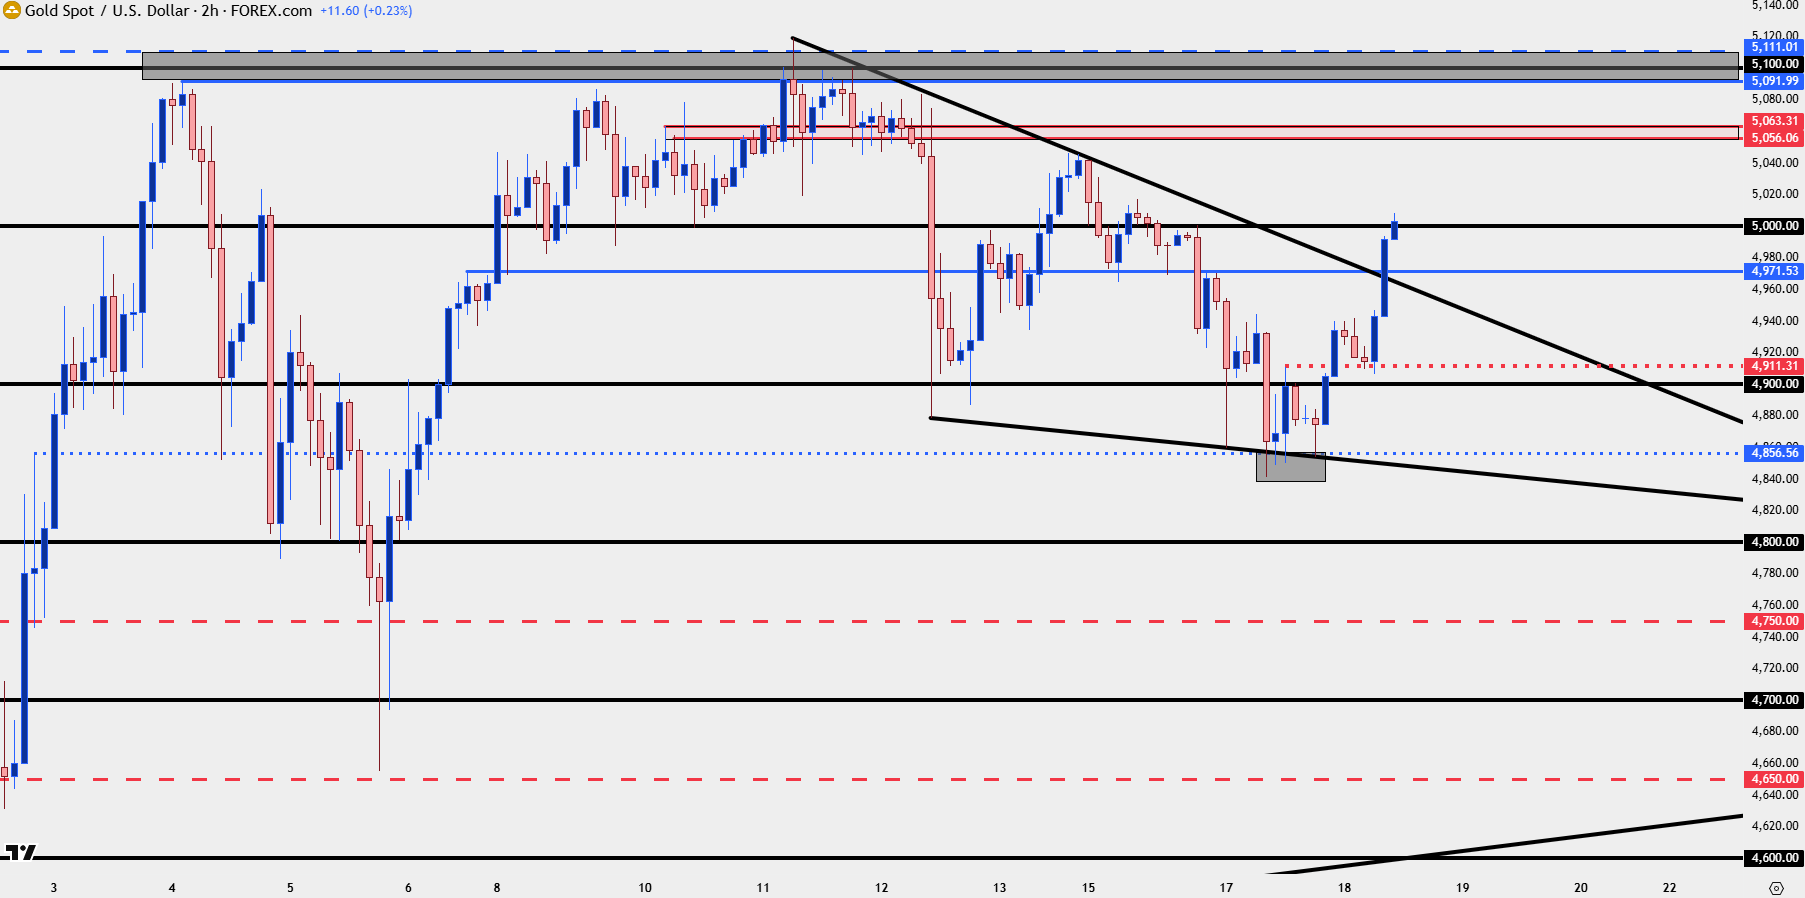
Chart prepared by James Stanley; data derived from Tradingview
--- written by James Stanley, Senior Market Analyst, Global Macro