- Gold forecast: Overbought technical indicators point to a potential pullback, though fundamentals remain strong
- The pace of the Fed's rate cuts could slow, reducing the impact of a key driver for buck-denominated gold prices
- Geopolitical tensions should mean limited downside on any short-term weakness
Gold’s performance in the last 7 months or so has been impressive, and many analysts are still expecting the rally to continue largely unchecked. While geopolitical tensions and optimism over central bank rate cuts have supported the yellow metal this year, some of the long-term technical indicators are flashing warning signs that a pullback might be on the cards. In this gold forecast, I’ll dive into why a short-term correction seems likely, but also why traders should keep their eye on key support levels as I continue to think $3,000 is still on the cards at some point down the line.
Gold wrapped up last week with little movement, unable to build on its prior gains. Without a significant catalyst to drive the dollar lower, gold’s upside potential is getting capped for now. The Dollar Index just finished one of its strongest weeks in recent months, dealing a blow to the ongoing bullish gold forecast and trend. When you consider the fact that gold is currently overbought across multiple timeframes, you’d think some profit-taking would make sense around current levels. So, a pullback, if not overdue, is certainly something to watch for.

Strong jobs data: What does it mean for the Fed and gold forecast?
The latest US jobs report was a curveball for the markets. A surprising print of 254,000 jobs in September sent ripples through the Fed’s plans. It added complexity to the "cooling economy" narrative, with the labour market still showing resilience. It underscored Fed Chair Jerome Powell’s view that we’re not going to see any further aggressive rate cuts this year. This strengthens the case for the dollar to remain supported, which in turn puts downward pressure on gold.
For traders, the implication is clear: while the longer-term gold forecast remains bullish due to geopolitical risks, Chinese stimulus and global central bank easing among other bullish factors, the short-term may see gold struggle to gain traction unless we see yet another shift in the Fed's stance.
Technical analysis: Overbought condition vs. strong bullish momentum
Now, let’s get into the technicals. On the surface, gold’s chart remains bullish, but warning signs are starting to accumulate. If we look at the Relative Strength Index (RSI), which now sits above 80 on the monthly chart, gold is heavily overbought. Historically, such high RSI readings have signalled a coming pullback or consolidation period.

So, don’t be surprised if we see some profit-taking soon, potentially resulting in some weakness in the gold price. On the daily time frame, the $2,635 level is crucial, and if gold dips below that level, it could ease to at least the $2,600 mark or even the slightly longer-term support levels such as $2,530 and $2,500.
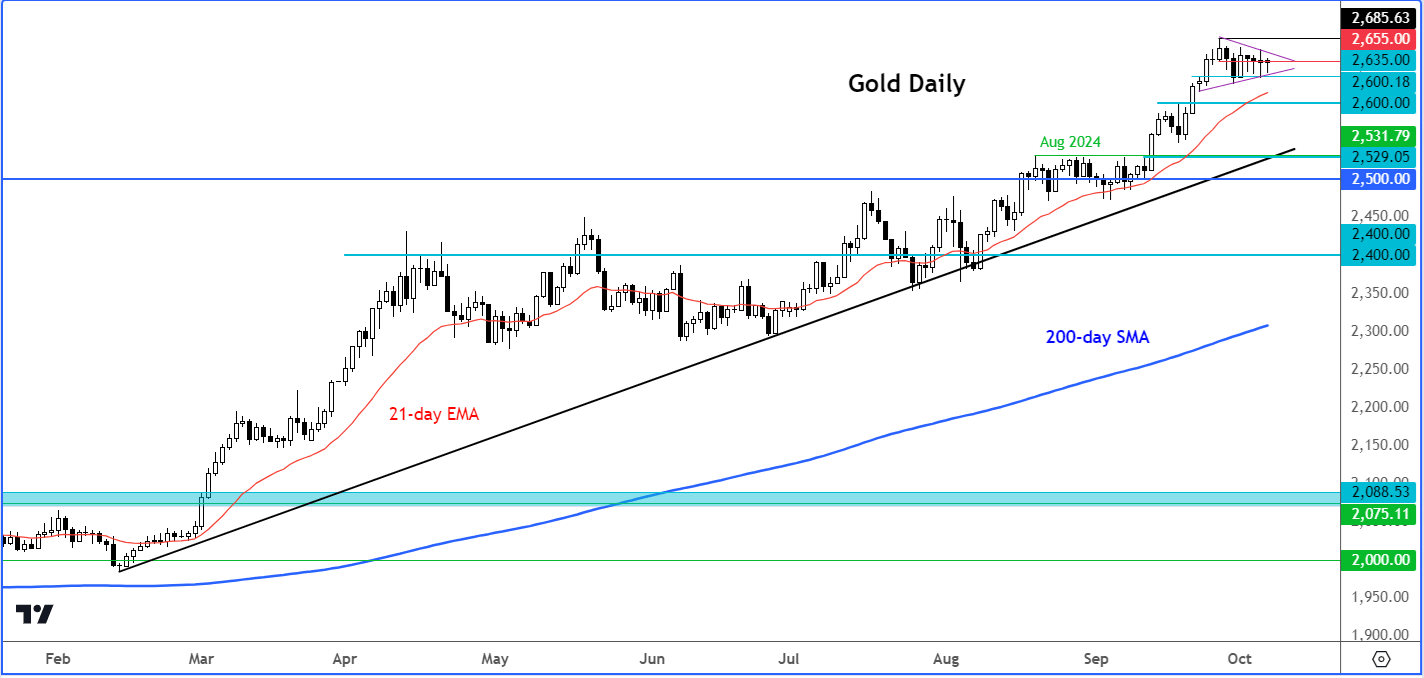
It’s worth noting that even if gold does experience a dip, the overall trend remains bullish. For those with a longer horizon, any correction could offer a chance to buy on the dip.
In the short-term, it’s essential to stay vigilant—especially with these overbought conditions—because a correction may be around the corner.
Source for all charts used in this article: TradingView.com
-- Written by Fawad Razaqzada, Market Analyst
Follow Fawad on Twitter @Trader_F_R