


Although gold prices have shown a steady recovery throughout the trading week, XAU/USD has failed to maintain consistent buying momentum into the close, posting a decline of around 0.5% during the session. This suggests that, beyond the recent upward movement, a neutral short-term dynamic is beginning to take shape.
For now, the lack of sustained price momentum follows the release of U.S. inflation data, which once again triggered movements in substitute markets such as bonds. As long as bonds continue to offer relatively attractive conditions, this could support a continued neutral bias in gold price action in the short term.

U.S. inflation day
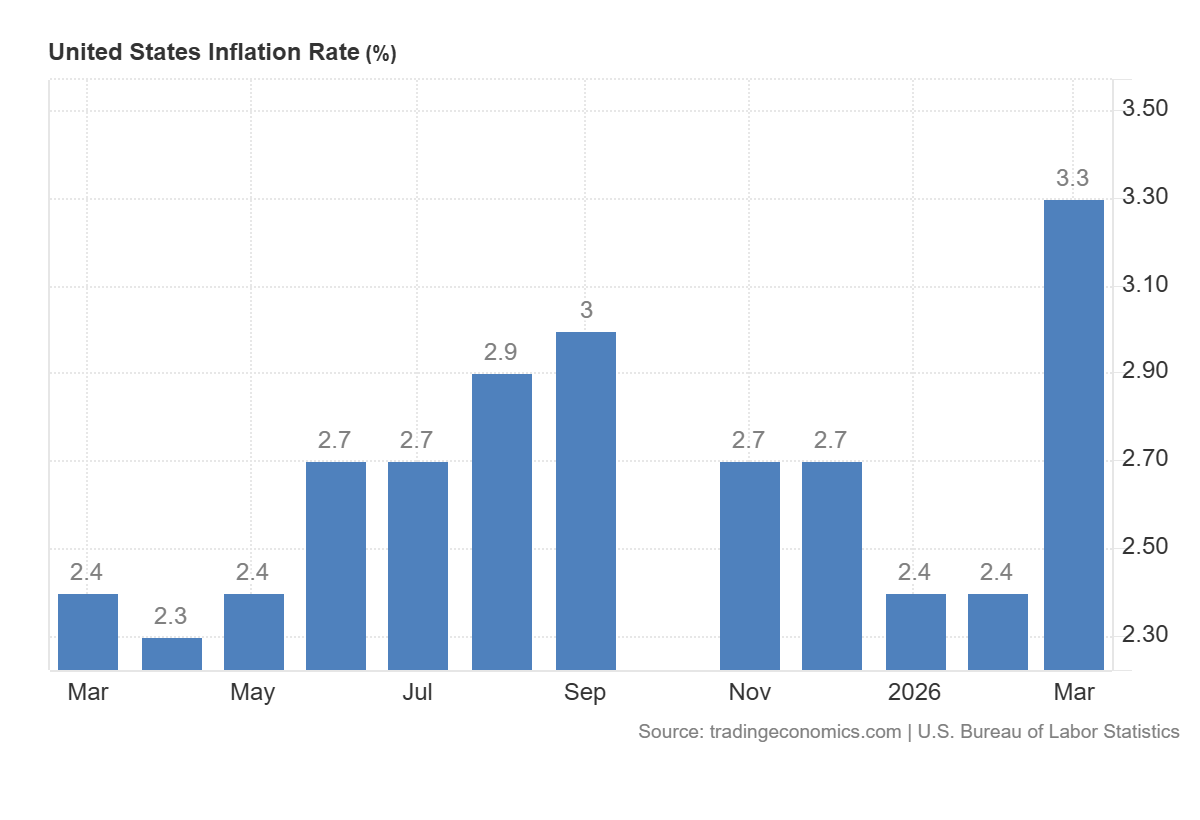
During today’s trading session, the latest U.S. inflation data was released, with the CPI year-over-year reading for March coming in at 3.3%, slightly below the expected 3.4%, but still above the previous 2.4%.
Although the data came in close to expectations, the key takeaway is that inflation continues to show a relevant upward trend, moving further away from the Federal Reserve’s target near 2.00%. This dynamic is becoming increasingly important for upcoming monetary policy decisions, as rising inflation has been a consistent theme in recent data.
Source: TradingEconomics
This development is significant because it confirms the Federal Reserve’s outlook regarding persistent inflation pressures. According to CME Group probabilities, there remains a greater than 70% likelihood that rates will stay unchanged at 3.75% until at least January 2027, and above 50% probability that this scenario extends through July of that year.
The only meaningful rate-cut scenario appears around October 2027, with a probability of approximately 39.9% for a reduction to 3.5%. This indicates that, for now, inflation data continues to support expectations of prolonged rate stability, with no major changes anticipated in the short term.

Source: CMEGROUP
Given this context, the expectation of stable monetary policy has helped maintain relative stability in U.S. 10-year Treasury yields, which compete directly with gold as a safe-haven asset by offering yield.
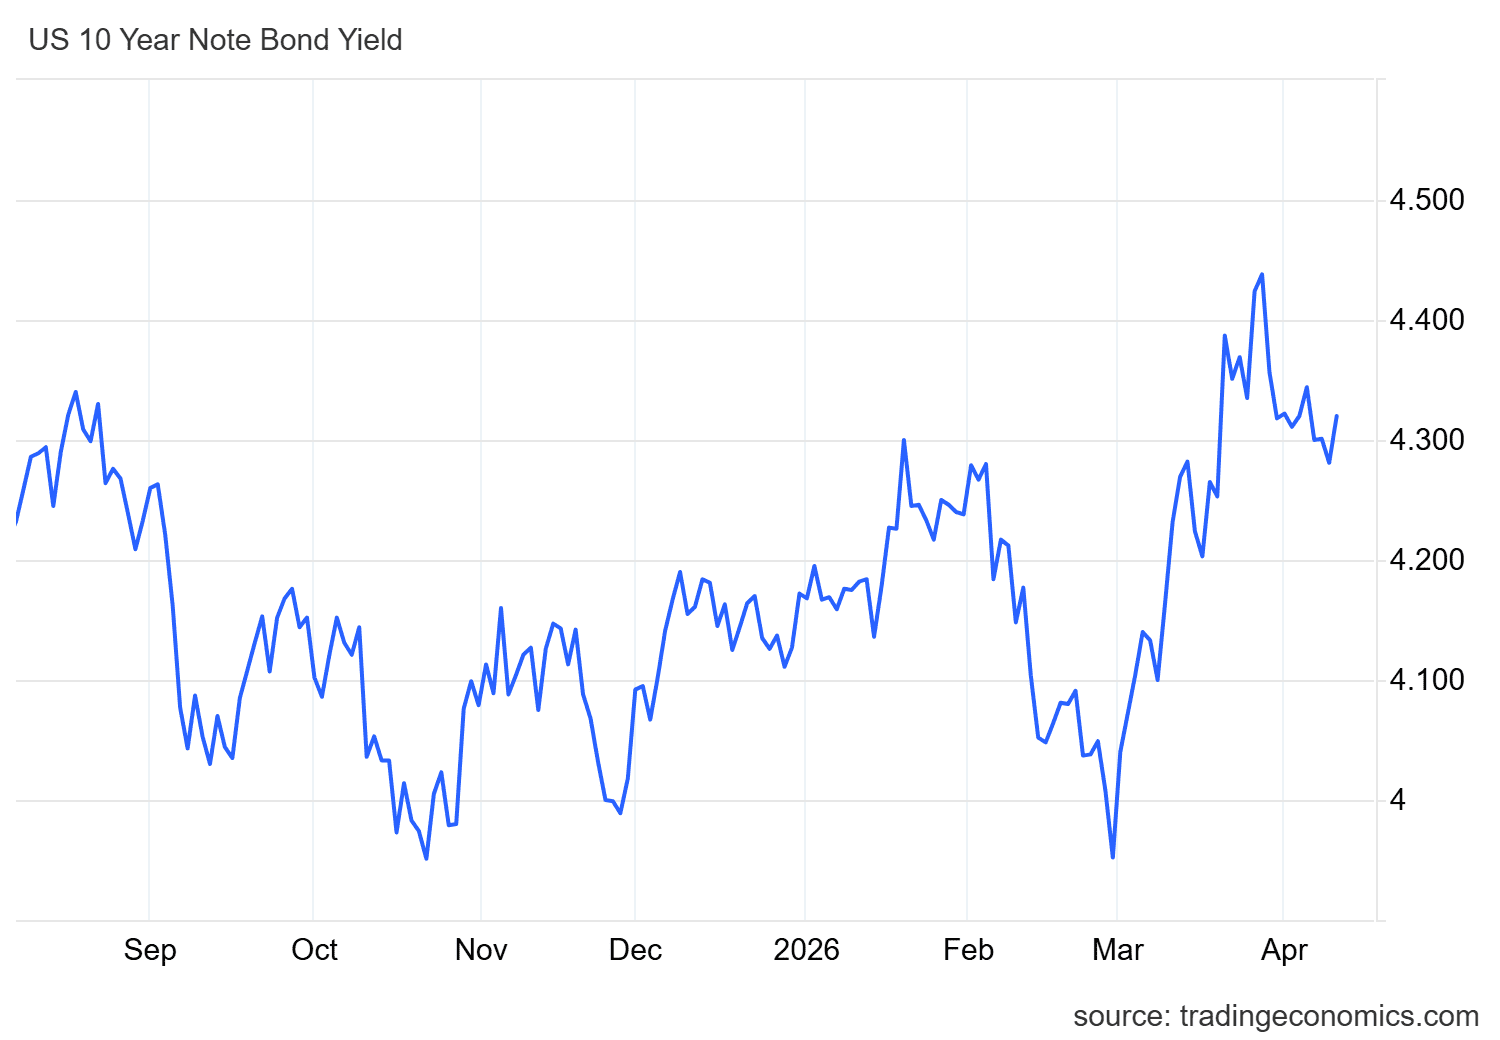
In fact, following the inflation data release, 10-year yields moved back above the 4.3% level, after previously declining toward 4.2% during the week. This suggests that the attractiveness of fixed income assets has started to strengthen again into the weekly close.
Source: TradingEconomics
This behavior is particularly relevant for gold, as in recent weeks the metal has shown weakness whenever yields rise. In this scenario, the recent recovery in yields could be limiting gold’s ability to sustain consistent demand, as investors may prefer assets that offer returns.
Therefore, as long as yields remain elevated and attractive, this environment could continue to limit a sustained recovery in gold prices, allowing the current neutral phase to evolve into a more pronounced phase of indecision in the coming sessions.
Gold Technical Outlook
Source: StoneX, Tradingview
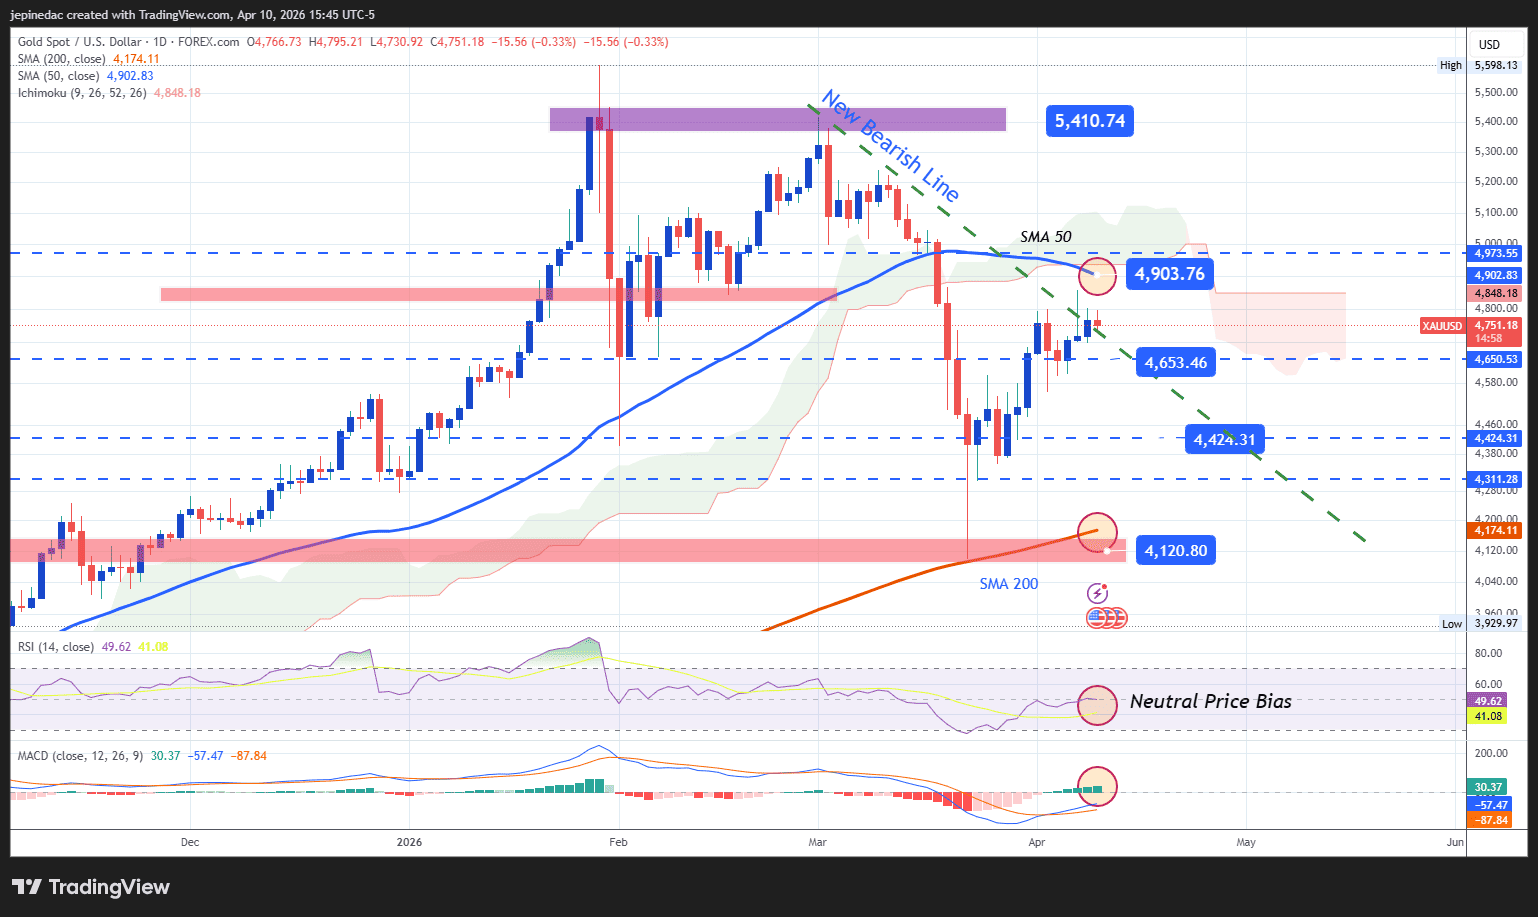
- Price struggles against the long-term downtrend: The recent recovery in gold prices has not been strong enough to break the long-term downward trendline, which remains the dominant technical structure in the chart. If this level is not broken consistently, it will continue to condition price movements in the near term. For now, the rebound is not sufficient to confirm a structural shift, and price action remains within a short-term indecision phase.
- RSI: The RSI continues to hover around the 50 level, reflecting a balance between buying and selling momentum over the last 14 sessions. This confirms that the market remains in a state of equilibrium, with no clear directional bias.
- MACD: The MACD histogram remains very close to the zero line, indicating a balanced short-term momentum in moving averages. As long as it stays near this level, the lack of direction is likely to persist.
Key levels to watch:
- $4,900 – Key resistance: A significant high aligned with the 50-period moving average. A sustained move above this level could break the current downtrend and open the door for a more dominant bullish bias in the coming weeks.
- $4,650 – Near-term barrier: A neutral zone that has acted as a consistent retracement level in recent weeks. Price action around this level could reinforce a sideways or indecisive scenario, potentially leading to a more defined range.
- $4,400 – Key support: A recent low that remains the most relevant downside barrier. A move toward this level could reinforce the bearish bias and support a continuation of the downtrend in the coming sessions.
Written by Julian Pineda, CFA, CMT – Market Analyst
Follow him on: @julianpineda25






