
Could sector rotation be signalling that the RBA is approaching another turning point? The Materials/Technology ratio has rolled over, while improving sector breadth supports the ASX 200 rally. Yet resistance around 9200–9250 could present a near-term hurdle for bulls seeking fresh record highs.
View related analysis:
- AU Consumer and Business Confidence Slide, Building the Case for an RBA Pause
- ASX 200 Futures Hold Relatively Firm as Nikkei Plunges After Wall Street Rout
- US Dollar Forecast: AUD/USD, Gold, EUR/USD Under Pressure
- Australian Dollar Outlook: AUD/USD Bears Eye March Low as US CPI Looms
ASX 200 Nears Record High as Sector Rotation Signals Further Upside
Sector Rotation Hints at Peak Cash Rate for RBA
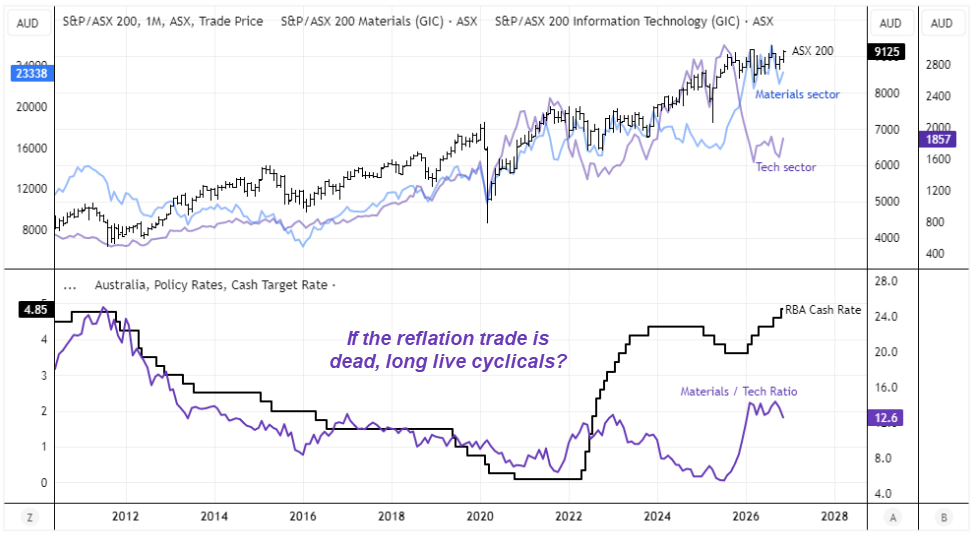
An interesting development beneath the ASX 200's recovery has been the resurgence of materials relative to technology. The Materials/Technology ratio recovered sharply from its 2025 lows, even as the RBA resumed tightening monetary policy. Yet the ratio has recently rolled over, despite the cash rate continuing higher.
Interestingly, the ratio also appears to have led some previous turning points in the RBA's cash rate. Its prolonged decline preceded the RBA's easing cycle in 2011, while its recovery around the 2022 tightening cycle reflected a shift towards cyclical stocks.
While the relationship is far from perfect, it raises an interesting question: could the recent rollover in the Materials/Technology ratio be signalling that the RBA is approaching the peak of its tightening cycle?
The ratio is not a direct measure of inflation expectations, and its apparent lead over monetary policy has not been statistically verified. However, it offers an interesting perspective on how equity markets may be anticipating changes in the economic and interest rate cycle.
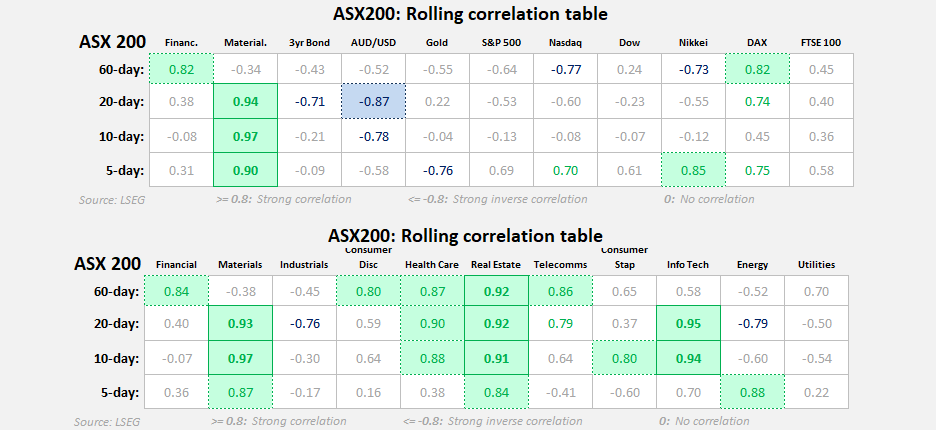
ASX 200 Correlations: Global Markets and Sector Rotation
Overall, the correlations suggest the ASX is beginning to reconnect with global equity markets, while materials, real estate and technology are moving closely with the index. However, shorter-term correlations can shift quickly, so the emerging relationships warrant monitoring.
- Global equity correlations are turning positive: The ASX's 5-day correlations with the S&P 500 (+0.69), Nasdaq (+0.70) and Nikkei 225 (+0.85) have turned positive, contrasting with their negative 60-day relationships.
- Materials remain closely aligned with the ASX: The sector's 10-day correlation sits at +0.97, highlighting its close relationship with the broader index during the recent recovery.
- Real estate and technology are also closely aligned: Both sectors have strong positive 20-day correlations of +0.92 and +0.95, respectively.
- Financials are less closely correlated: Despite their constructive technical pattern, the sector's 20-day correlation is relatively modest at +0.40.
- The Australian dollar remains inversely correlated: AUD/USD has a 20-day correlation of -0.87, suggesting recent ASX strength has coincided with Australian dollar weakness.
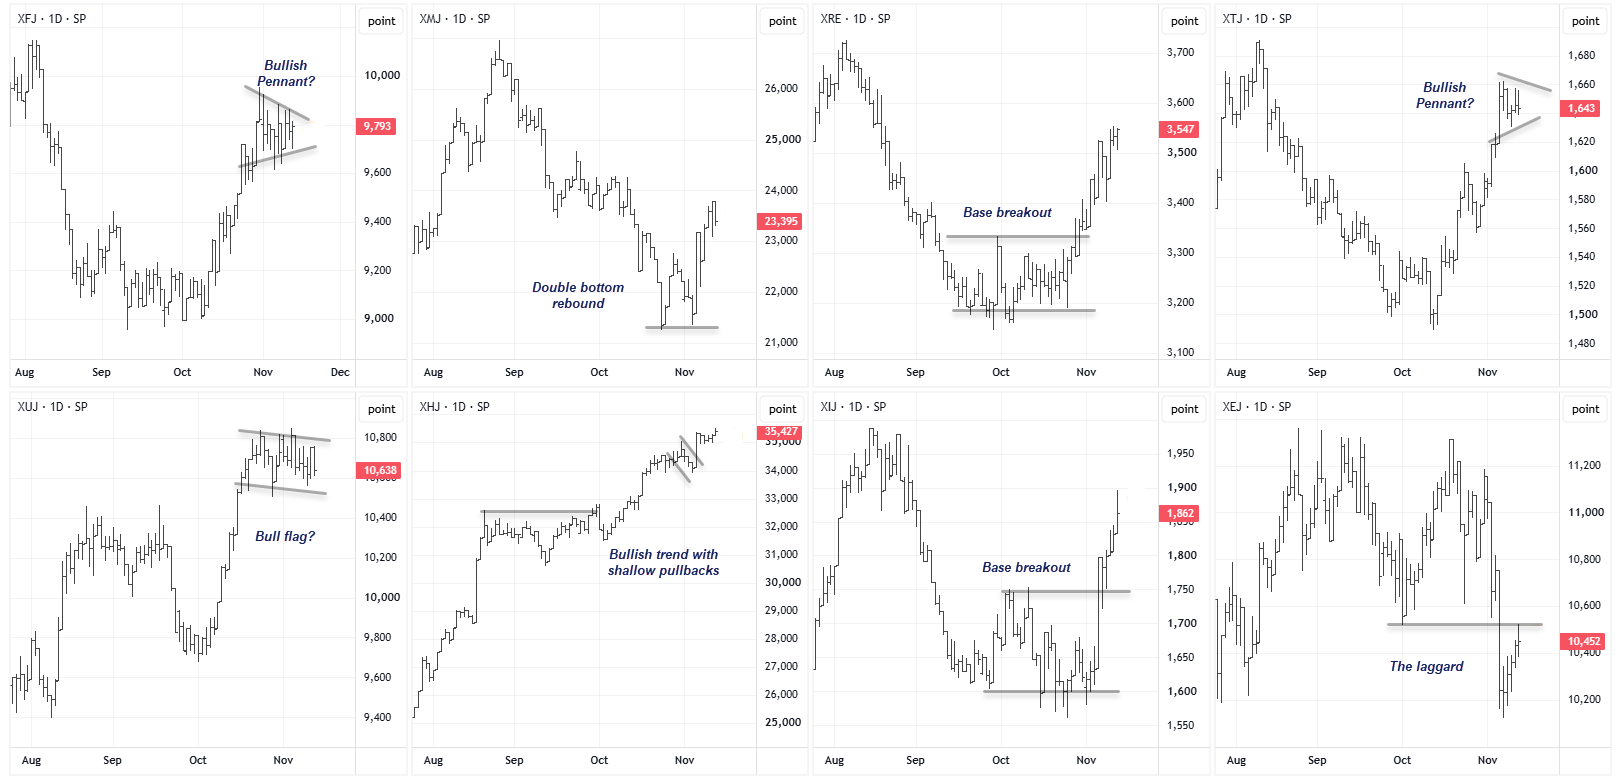
ASX 200 Sector Breadth Shows Encouraging Signs
The recovery is broadening across ASX 200 sectors, with several bullish continuation patterns and base breakouts suggesting further upside potential.
- Financials and Communication Services: Potential bullish pennants have formed following strong rallies, although breakouts are yet to be confirmed.
- Real Estate and Technology: Both sectors have broken above established trading ranges, signalling improving bullish momentum.
- Healthcare: One of the strongest sectors, maintaining a bullish trend with shallow pullbacks and fresh highs.
- Materials: A double-bottom rebound has emerged, although prices remain below their previous highs.
- Utilities: A potential bull flag suggests the sector could be preparing for another leg higher.
- Energy: The clear laggard, with its recent rebound struggling beneath former support.
Source: ASX, LSEG

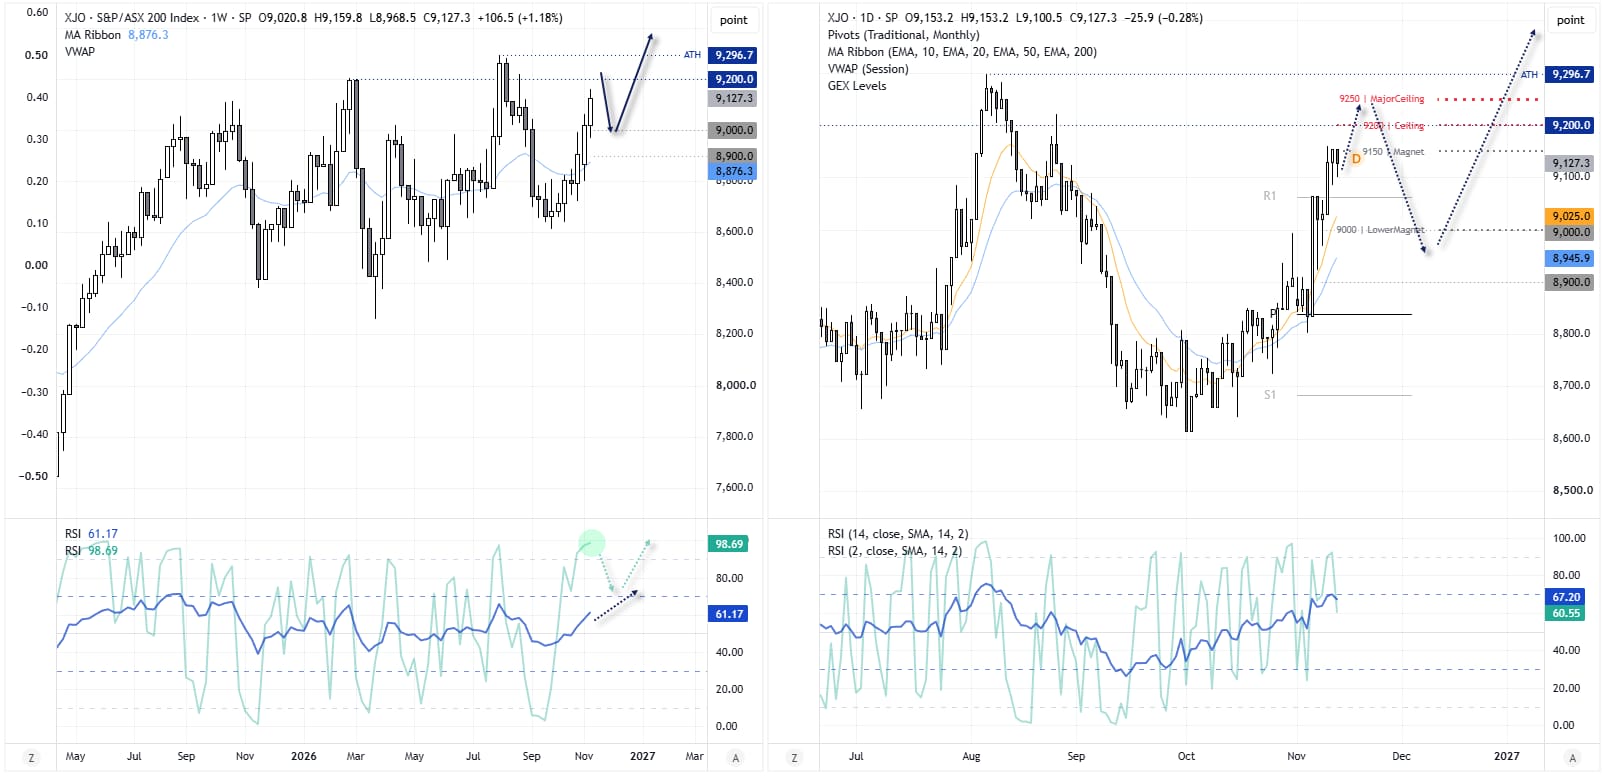
ASX 200 Technical Analysis: Rally Approaches 9200–9250 Resistance
It has been six weeks since the ASX 200 began its rally from the swing low around 8600. While bullish momentum remains strong, the March high near 9200 strikes me as an area where bulls may look to lighten their exposure, at least over the near term. The weekly RSI (2) is also deeply overbought, adding to the risk of a pause or pullback.
My broader bias remains for an eventual break to a new record high, although nearby resistance suggests the rally could lose momentum first. Options positioning highlights 9200 as an important resistance level, with a larger concentration of call open interest at 9250. A pullback towards 9000 could therefore appeal to bulls looking to rejoin the trend at more favourable prices.
Source: ASX, TradignView