
Gold and silver prices are sliding on extended war risks, despite the latest optimism surrounding ceasefire talks. Bearish setups remain in focus as long as key resistance levels hold.
Monday’s price action saw a +$400 jump in gold and a +$10 surge in silver, before both metals consolidated near critical resistance levels and pulled back below them.
Key Levels to Watch
- Gold: $4600–$4680 resistance, $4200–$3900 support
- Silver: $75 resistance, $60 support
- DXY: 100.50 resistance, 98 support (Latest DXY setup: EURUSD, DXY Price Outlook: Double Top and Bottom Scenarios)
Gold and silver typically act as safe havens during geopolitical conflicts. However, with crude prices remaining elevated near the $100 mark, inflationary pressures continue to ripple across global markets. This is reflected in higher yields, hawkish central bank stances, including the ECB’s rate outlook, and the extended timeline required for the Strait of Hormuz to resume normal operations.
Alternative supply routes are also under scrutiny to minimize disruption risks. At the same time, ceasefire developments continue to influence market sentiment and price swings, which can be better assessed through higher time frame technical levels.
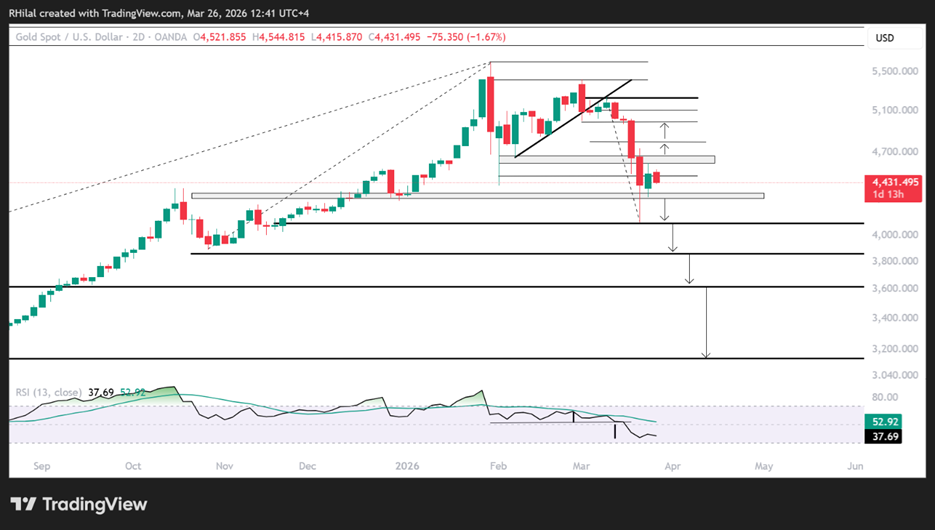
Gold Price Outlook: 2-Day Time Frame – Log Scale
Source: Trading view
Using a 2-day time frame to smooth out volatility, gold price action is consolidating below the 4600–4680 resistance zone, which acts as the key divider between continued bearish structure and a potential short-term bullish shift.
Bullish Scenario:
A close above the 4680 level opens the door for gains towards 4800 and 4980, aligning with the 0.618 and 0.786 Fibonacci retracement levels of the downtrend from the March 10 high at 5240 to the March 20 low at 4080. A sustained move above 4980 and 5250 would realign the longer-term bullish trend, exposing 5600 and 6000 as next upside targets.
Bearish Scenario:
A close below the 4300 and 4080 support levels would extend downside risks towards 3860, 3620, and 3140, respectively. These levels align with key Fibonacci retracement zones of the broader uptrend from the 2022 lows to the 2026 highs, presenting potential long-term dip-buying areas.
- 4,080: 0.382 Fibonacci ratio, already established as a support and dip-buying zone
- 3860: 0.44 Fibonacci ratio, potential short-term rebound level
- 3620: 0.5 Fibonacci ratio, potential medium-term rebound level
- 3150: 0.618 Fibonacci ratio, the golden ratio with a higher probability of a stronger rebound
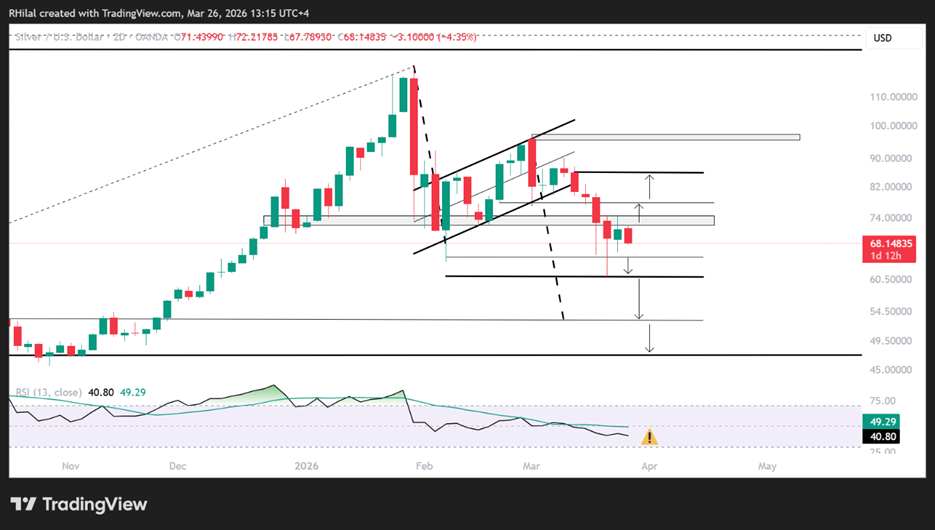
Silver Price Outlook: 2-Day Time Frame – Log Scale
Source: Trading view
On the 2-day time frame, silver price action also maintains a bearish bias below the 75 resistance level, which separates a potential short-term bullish recovery from continued downside risks.
Bullish Scenario:
A close above 75 would support a move towards 77.80, 82, and 85, followed by a potential retest of the 96 resistance level. A sustained breakout above this zone could open the door to higher targets near 130 and 200. This scenario would likely align with a broader rally in gold towards the 6000 level.
Bearish Scenario:
A close below 65 and 60 would confirm further downside within a bearish flag structure, targeting the 55 and 48–47 zone. This area represents a historically significant resistance-turned-support level dating back to 1980, and aligns with the 0.618 and 0.786 Fibonacci retracement levels of the 2022–2026 uptrend.
Written by Razan Hilal, CMT
Follow on X: @Rh_waves