

Earlier today I published an article highlighting the relationship between oil prices and currencies, with the US Dollar and in-turn major FX pairs sharing an increasingly strong relationship with oil prices.
But perhaps more to the point, and the focus of US policymakers, is the impact of oil prices on stocks, which was clear and apparent at the start of this week. As oil prices gapped higher on the back of heightened tensions in the Middle East, US equity prices broke lower, with the Nasdaq 100 re-testing a massive line-in-the-sand at the 24k level.
This is the same spot that held the lows back in November, after stocks sold off following the FOMC rate decision in late-October when the Fed didn’t sound as dovish as markets wanted to hear. So far – that line in the sand has held, and a strong rally developed on Monday that catapulted prices back to 25k. But since then, with continued unease around the Strait of Hormuz, that resistance has held at 25k and prices have pushed back into another area of prior support.
Nasdaq 100 Daily Chart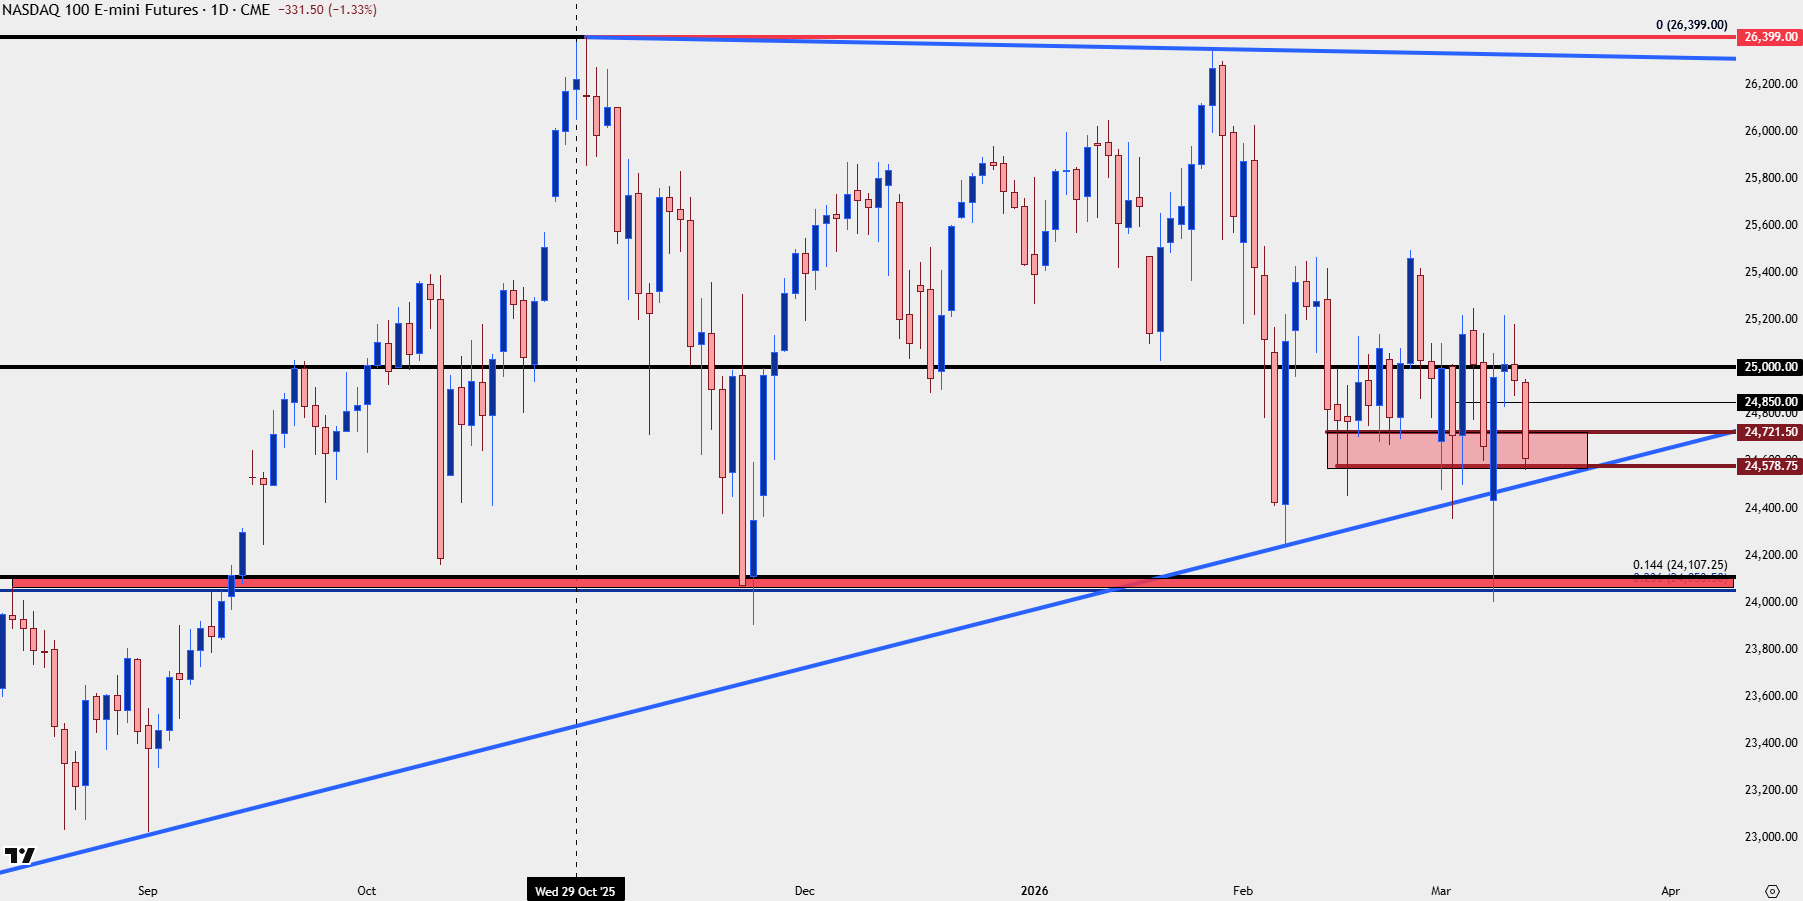
Chart prepared by James Stanley; data derived from Tradingview
Nasdaq 100: The Drivers
At this point markets remain jumpy around the Strait of Hormuz and there’s a few other factors of consideration. Tomorrow morning brings quite a few US data releases, with the Core PCE report perhaps the most notable as this is the Fed’s preferred inflation gauge. It’s expected to come out at 3.1% which, if so, makes for a more difficult argument for FOMC rate cuts which have been getting priced-down of recent.
But perhaps more to the point is what President Trump might say ahead of the weekend to re-capture the narrative around the ongoing war efforts. From the past week there’s been a few items, such as the SPR release and the multiple quotes saying that the war was almost over. Tomorrow seems like opportune timing as Trump likely won’t want markets to close on a grim note, so the prospect of an equity pump ahead of the weekend could make sense.
In the Nasdaq 100, this sets up a few levels of note: First, the 24k level that’s already come in as support sets up as a crucial spot for buyers to hold. Above that, as we’re seeing so far today, the ‘s2’ zone that I had looked at a couple weeks ago remains in-play and as you can see from the numerous candlestick wicks on the daily chart above, there’s been a propensity for buyers to show up in the 24578-24721 area of the chart. If this support can hold sellers back through tomorrow’s cash open at 9:30 AM ET, there would be an open door for bulls to push up for another 25k re-test.
For the Nasdaq to ultimately leave behind that 25k level, it would seem that we would need some degree of finality to the war, with the idea that the worst is in the rear view and that peace, or relative peace, would be around the next corner.
Nasdaq 100 Four-Hour Chart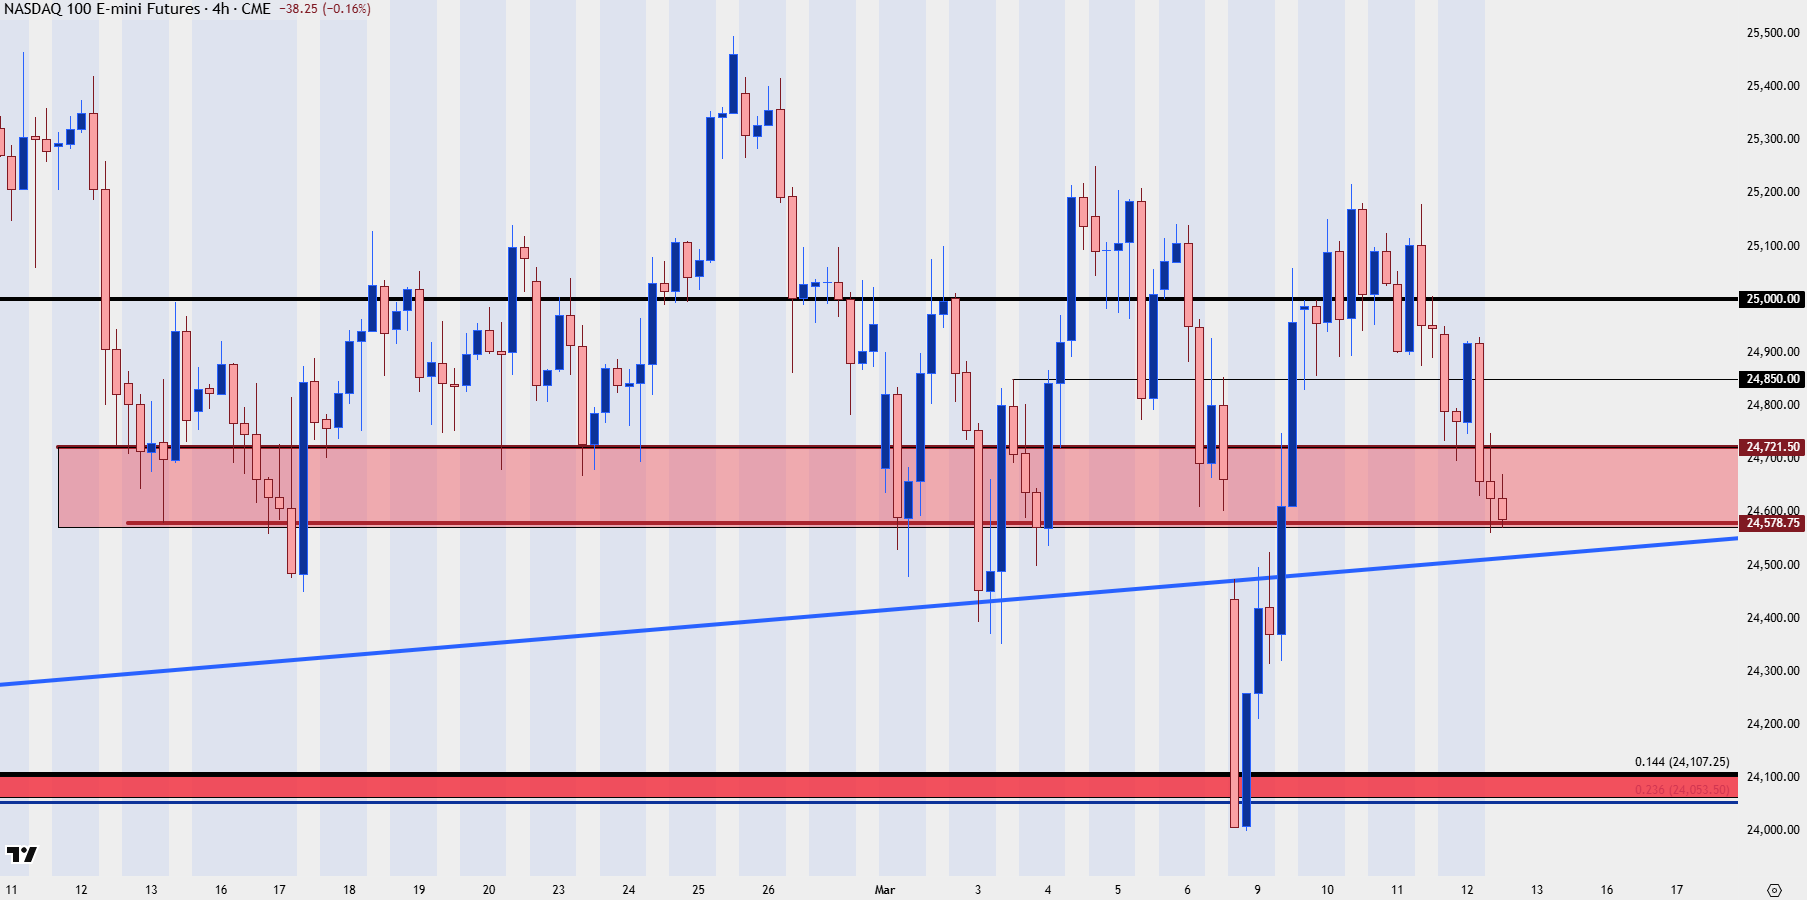
Chart prepared by James Stanley; data derived from Tradingview
--- written by James Stanley, Senior Market Analyst, Global Macro