
Key Events
- Momentum across U.S. indices slows between holiday periods and ongoing government resolution hopes.
- U.S. CPI, tentatively scheduled for Thursday this week, defines a key volatility catalyst for markets.
- The Russell 2000 continues to struggle below its four-year resistance, while the Nasdaq holds in a neutral zone below 25,700.
Russell 2000 vs SP 500, Dow, and Nasdaq
Source: Tradingview
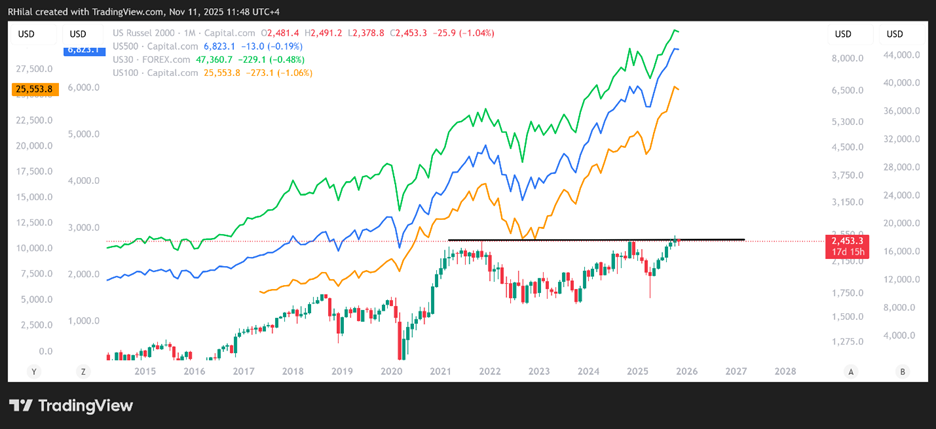
The Russell 2000, the leader of U.S. small-cap stocks, is once again struggling near its 2,500 record and 4- year resistance. The previous times it reached this level, global indices experienced sharp sell-offs—the most recent being the 2025 tariff-induced correction.
As we approach the end of the year, concerns over stretched AI and tech valuations—with mega caps such as Microsoft and Nvidia surpassing $4 trillion in market capitalization—combined with tariff fatigue, dovish policy expectations, and labor market uncertainty, are weighing on sentiment. Indices appear to be on a neutral hold, with the Dow holding below 48,000, the Nasdaq below 26,300, and the Russell below 2,550.
- Key levels remain in focus to define the sustainability of the current trends:
A clean hold above 2,550 on the Russell, representing the 0.618 Fibonacci extension of the 2020 low, 2021 high, and 2023 low, is expected to support longer-term gains toward new records near 2,800. - However, as long as the index remains capped below resistance, the risk of forming a triple-top structure persists, potentially pressuring the broader market outlook.
Nasdaq, Russell, SP 500 Outlook: Daily Time Frame - Log Scale
Source: Tradingview
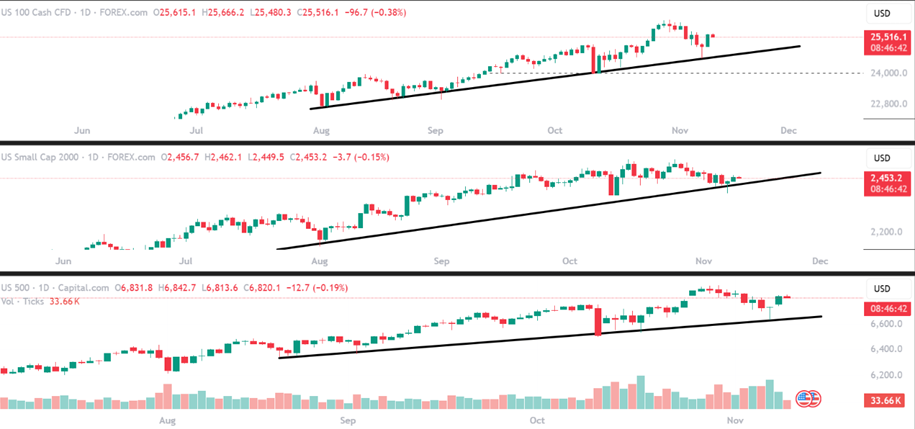
On the daily time frame, U.S. indices continue to respect the uptrend connecting consecutive higher lows since August, maintaining a bullish technical bias—unless a clear structural breakdown occurs.
Market sentiment briefly weakened amid U.S. government shutdown risks, testing key support once again. However, renewed hopes for a government resolution helped lift indices back to neutral territory, trading above critical support levels that separate bullish from bearish bias, and still below record highs.
Nasdaq Outlook: Daily Time Frame – Log Scale
Source: Trading view
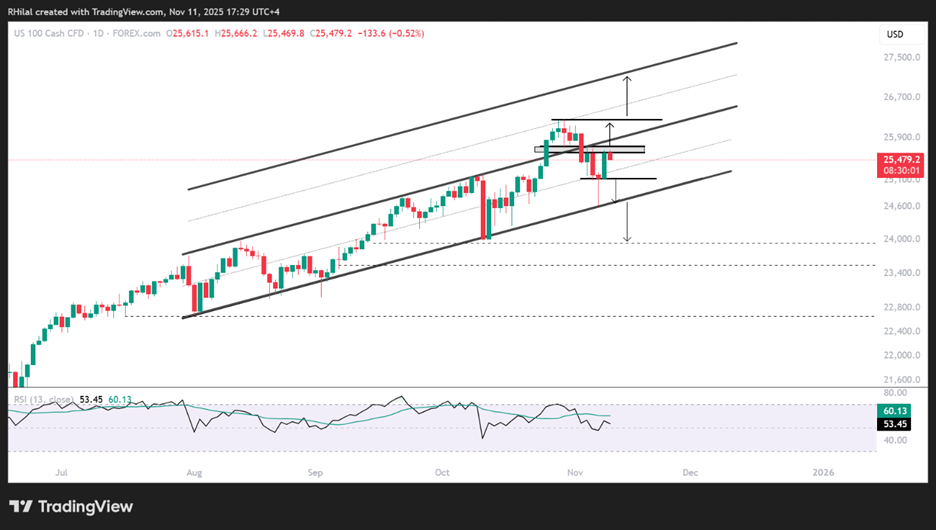
From a daily perspective, the Nasdaq is testing the upper bound of a parallel channel that has been respected since the August 2025. Price action previously broke to the mid-zone of the duplicated channel near 26,300, declined to the lower border of the original pattern near 24,650, and has since rebounded toward the upper edge around 25,700.
The scenarios from here are as follows:
- Bullish case: A confirmed hold above 25,700 could redirect gains toward 26,300, after which another bullish projection targets the upper boundary of the duplicated channel near 26,700–27,000.
- Bearish case: A drop back below 25,200 could pull prices toward 24,650, with further downside potential extending below the August–November support zone toward 23,900, 23,500, and, in extreme cases, 22,700.
Written by Razan Hilal, CMT
Follow on X: @Rh_waves