Last week saw Nasdaq 100 futures finish with a bullish engulf – and so far this week, that formation has played through with bulls continuing to launch a massive move to test the 25k level. At one point, the gain was a whopping 10% above last week’s low although that move has softened a bit and, as of this writing, the rally is standing at 9% with price grasping to that 25k level in NQ.
Nasdaq 100 Futures – Daily Chart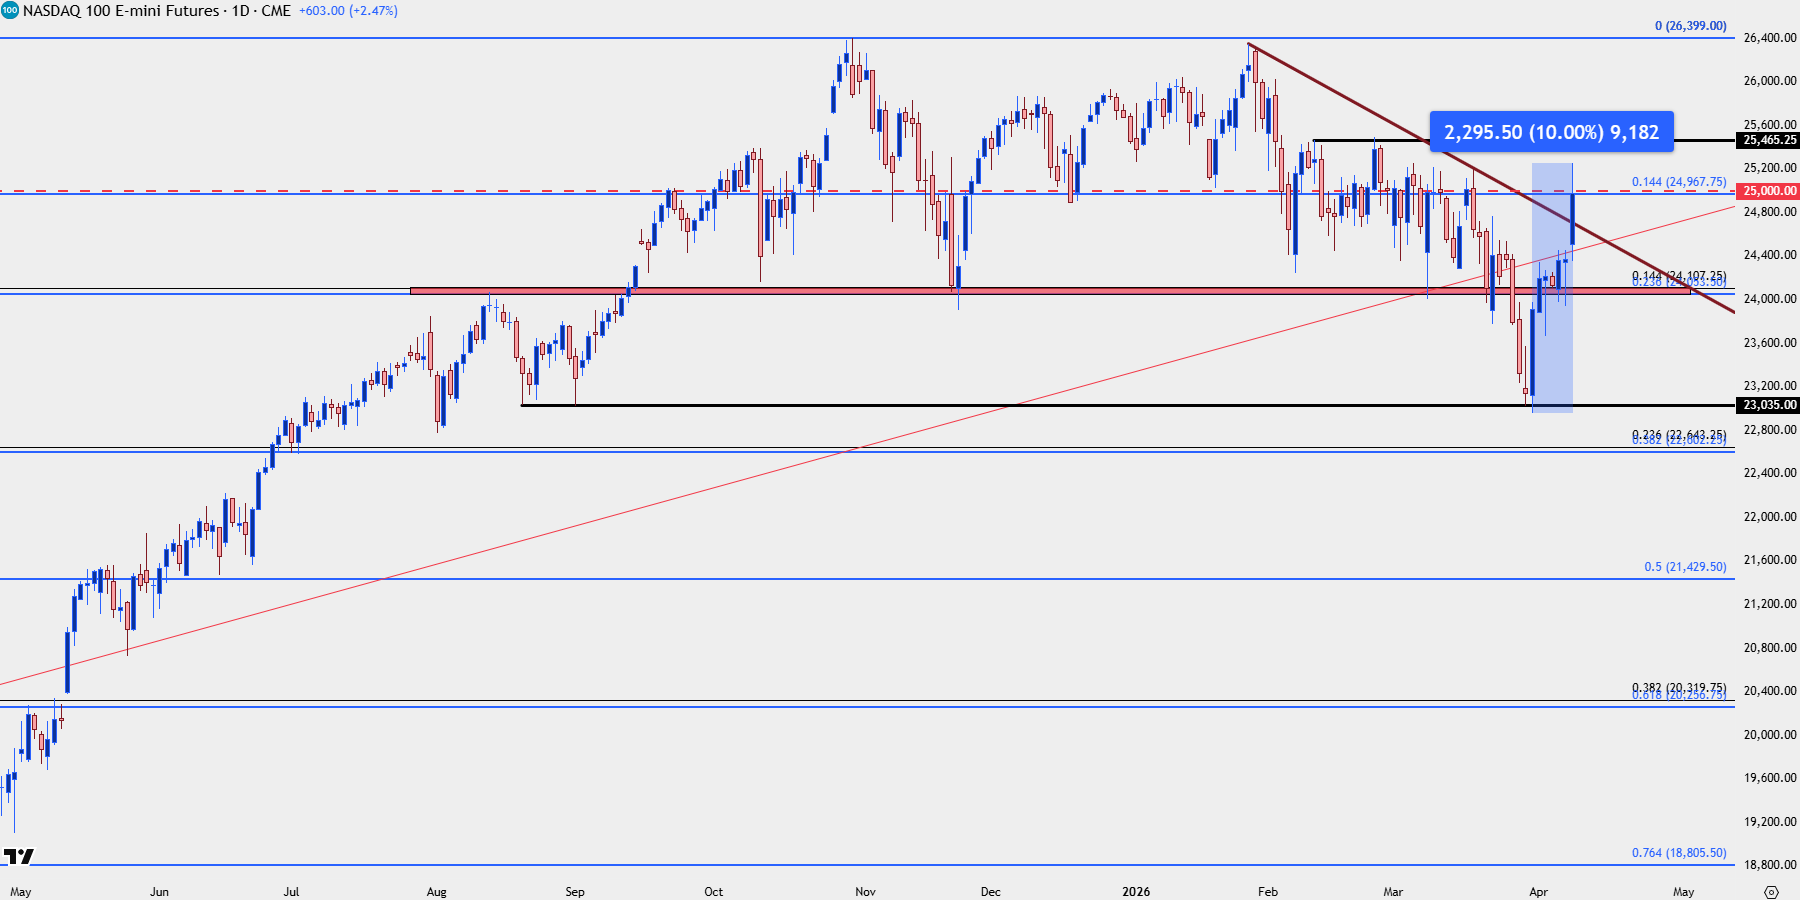
Chart prepared by James Stanley; data derived from Tradingview
With Bullish Trends Fear Can Spell Opportunity
Last year’s liberation day sell-off was fast and drove a lot of fear in the market, but it was also something that was squarely in the control of President Trump as he had the ability to back off of or delay tariffs, which ultimately is what happened to help start the bullish reversal in April.
This year’s episode, as we came into Q2, shared some similarity to that although there were more uncontrollable factors at bay considering the geopolitical risk. But, the overriding factor is that a President that often touts stock market performance as a barometer of their success was unlikely to cause anything that could create a major market meltdown, and for much of March, that helped the Nasdaq 100 to hold up relatively well even as small caps and the Dow started to look a bit more worrisome.
But a topic covered in yesterday’s webinar is the investor’s approach with equity names like NVDIA, which remain very near the all-time-highs established last year. While near-term pain whether it be from tariffs or conflict could threaten short-term trends, the longer-term backdrop, especially around the impact of AI, and something like fear-fueled pullbacks last year or this year can serve as opportunity for investors to buy the stock on a pullback.
At this point, NVDA has only retraced as much as 23.6% of the rally that started back in 2022 and has ran for as much as 1,862%! And that Fibonacci retracement has so far held the lows as price has built into a bounce.
If we do get another wave of selling, however, there could be scope for a deeper pullback that I’ll look at in a moment, and this could have a broader impact on the Nasdaq 100 index.
NVDA Weekly Price Chart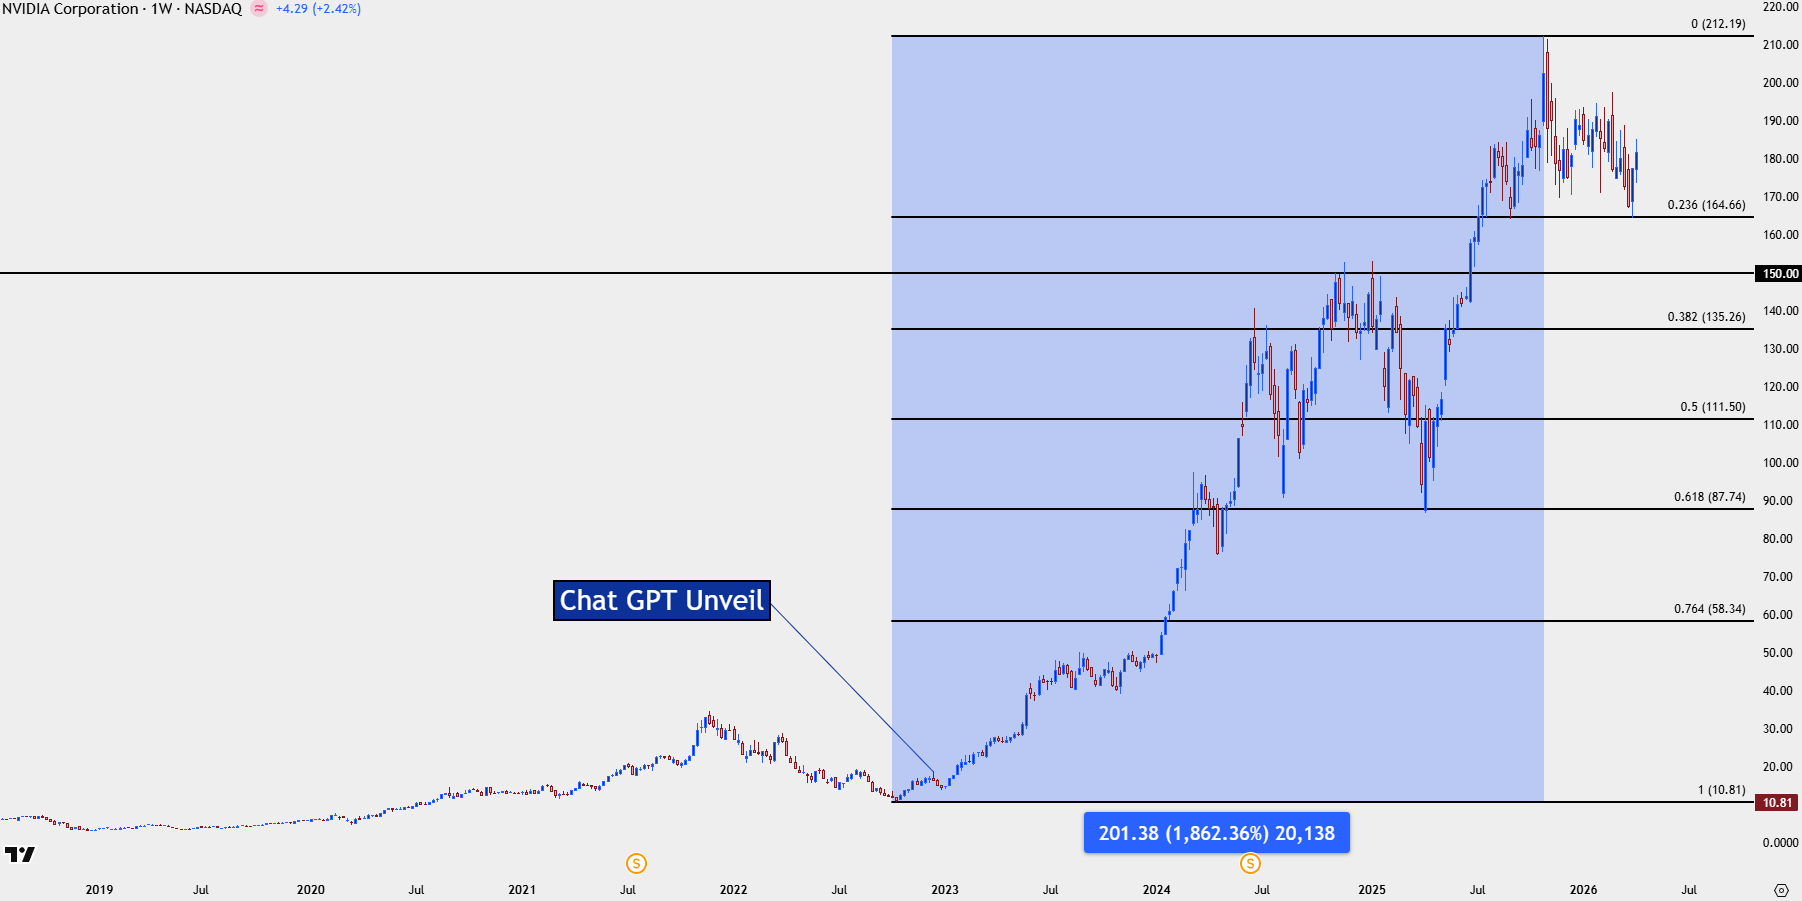
Chart prepared by James Stanley; data derived from Tradingview
NVDA Shorter-Term
From the daily chart we can see that this isn’t the first time that the price at the 23.6% retracement has led into a bounce, as that runs around 165.00 and that price is what helped to set the low back in September of last year.
And with that, we have the build of a possible head and shoulders pattern, with a neckline right at that level. If sellers can prod a break, that opens the door for breakdown potential and those formations are often tracked with aim of the measured move below support running for approximately the amount of distance from the top of the head to the neckline. That would point to approximately around the 116 area on the chart, which is confluent with the 50% retracement of the same major move.
For the formation to trigger, however, we’re going to need to see the neckline break and for that, we’ll probably need to see another wave of fear on the back of tensions in the Middle East.
NVDA Daily Chart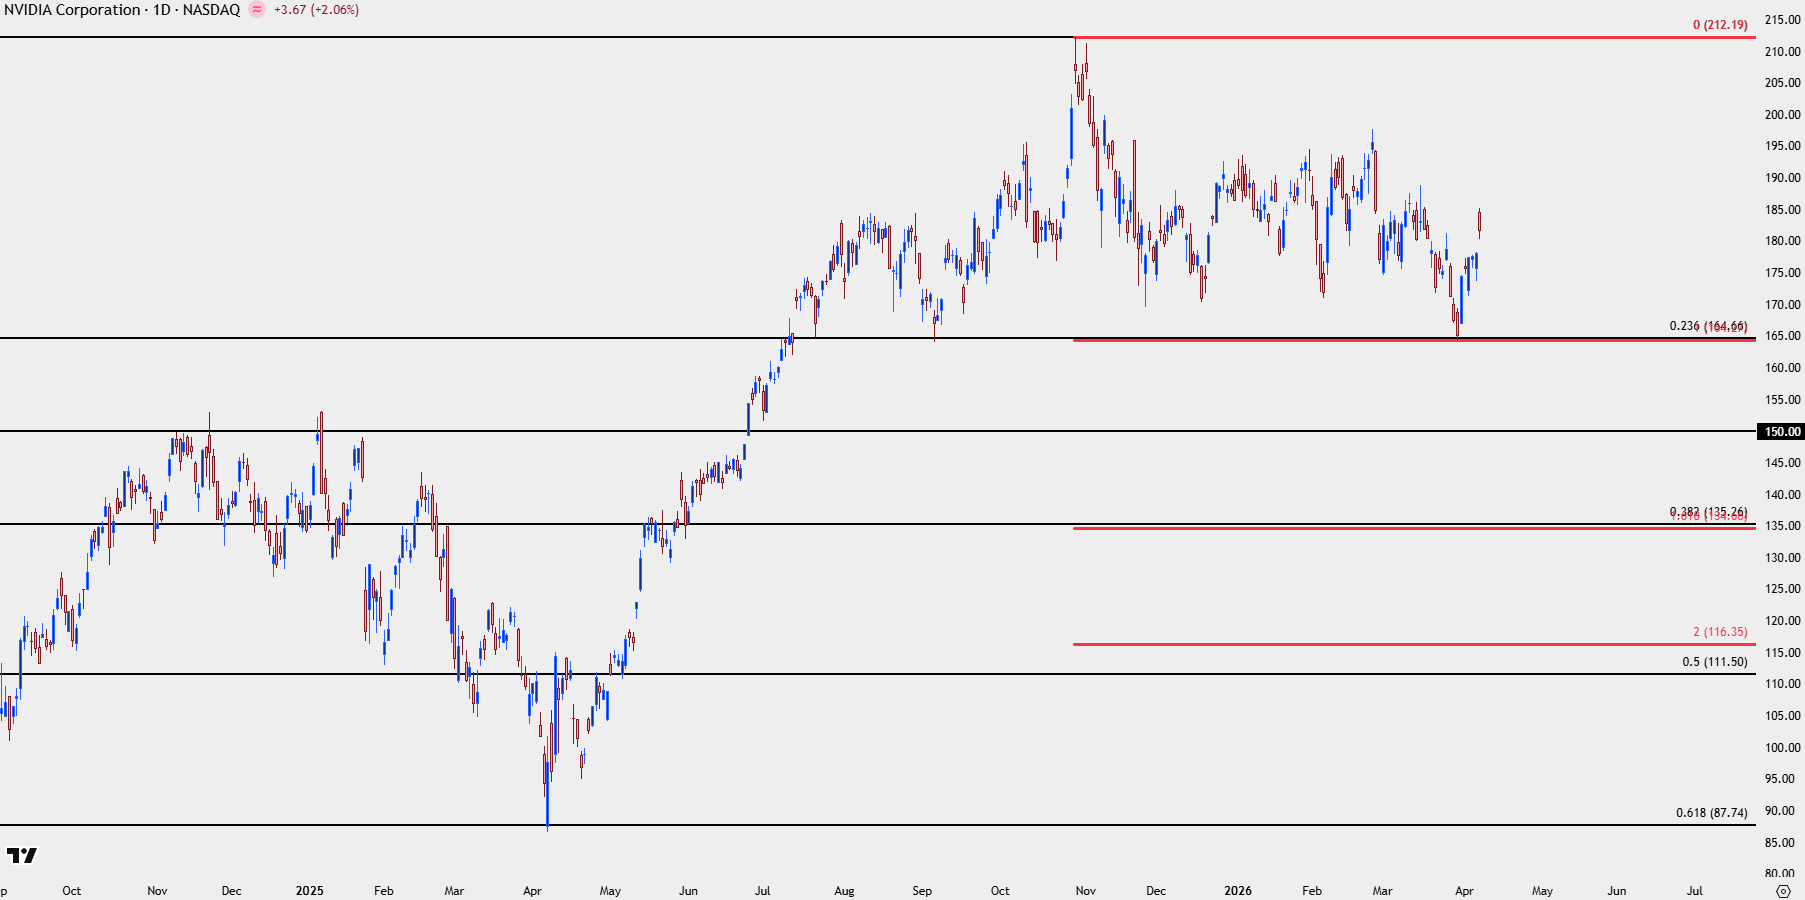
Chart prepared by James Stanley; data derived from Tradingview
NVDA Shorter-Term
Whether there’s a bottom already in or not remains to be seen and for higher-low support, there’s some remaining unfilled gap from this morning’s open that could be looked to for shorter-term bullish strategies.
If sellers push below that, however, the head and shoulders pattern above becomes the more notable theme and that’s something that can lead to broader selling in tech shares across the Nasdaq 100 index.
NVDIA Daily Chart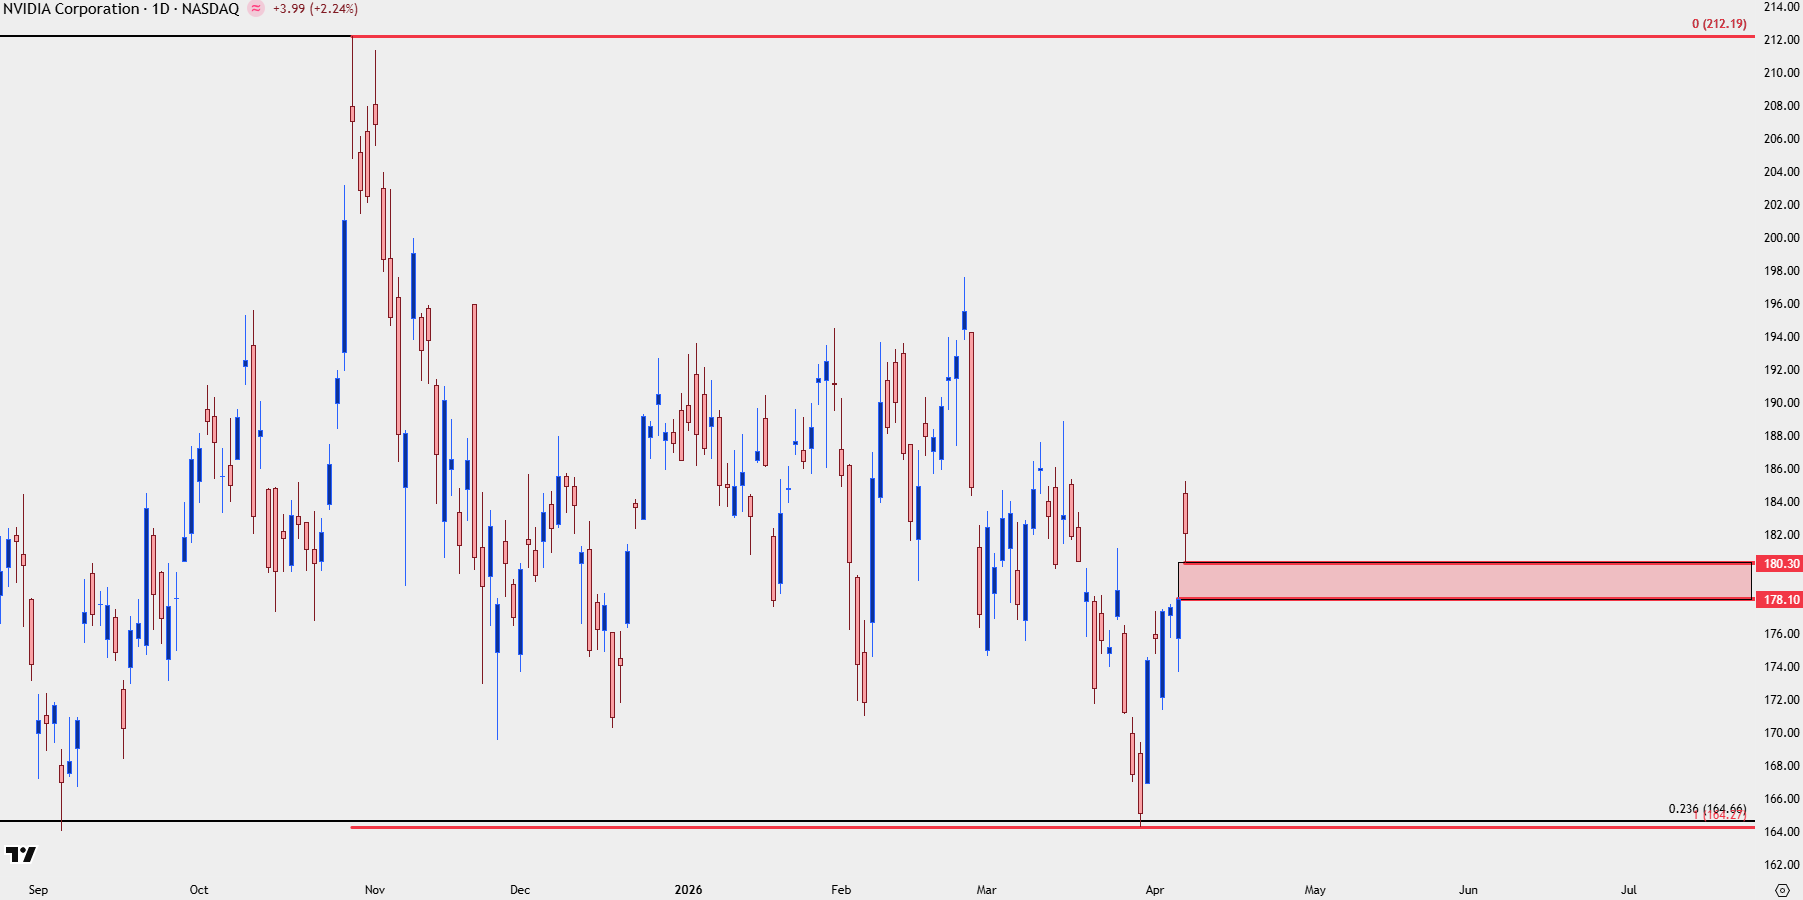
Chart prepared by James Stanley; data derived from Tradingview
Nasdaq 100
On a brighter note, the shorter-term backdrop in NQ futures highlights a possible inverse head and shoulders pattern, which is a bullish breakout formation if we see the neckline get pierced.
The projected move from that formation would point to a push up to 27,552, which would be a fresh ATH for the index and would likely need to be accompanied by a more confirmed case of conflict resolution in the Middle East, along with slower inflation that could re-open the door for Fed cuts later in the year. While that backdrop may seem unlikely from where we’re at now, there’s also support potential to work with on pullbacks, such as the 24,578-24,721 zone after which the zone around 24,100 comes back into the picture.
Nasdaq 100 Futures Four-Hour Chart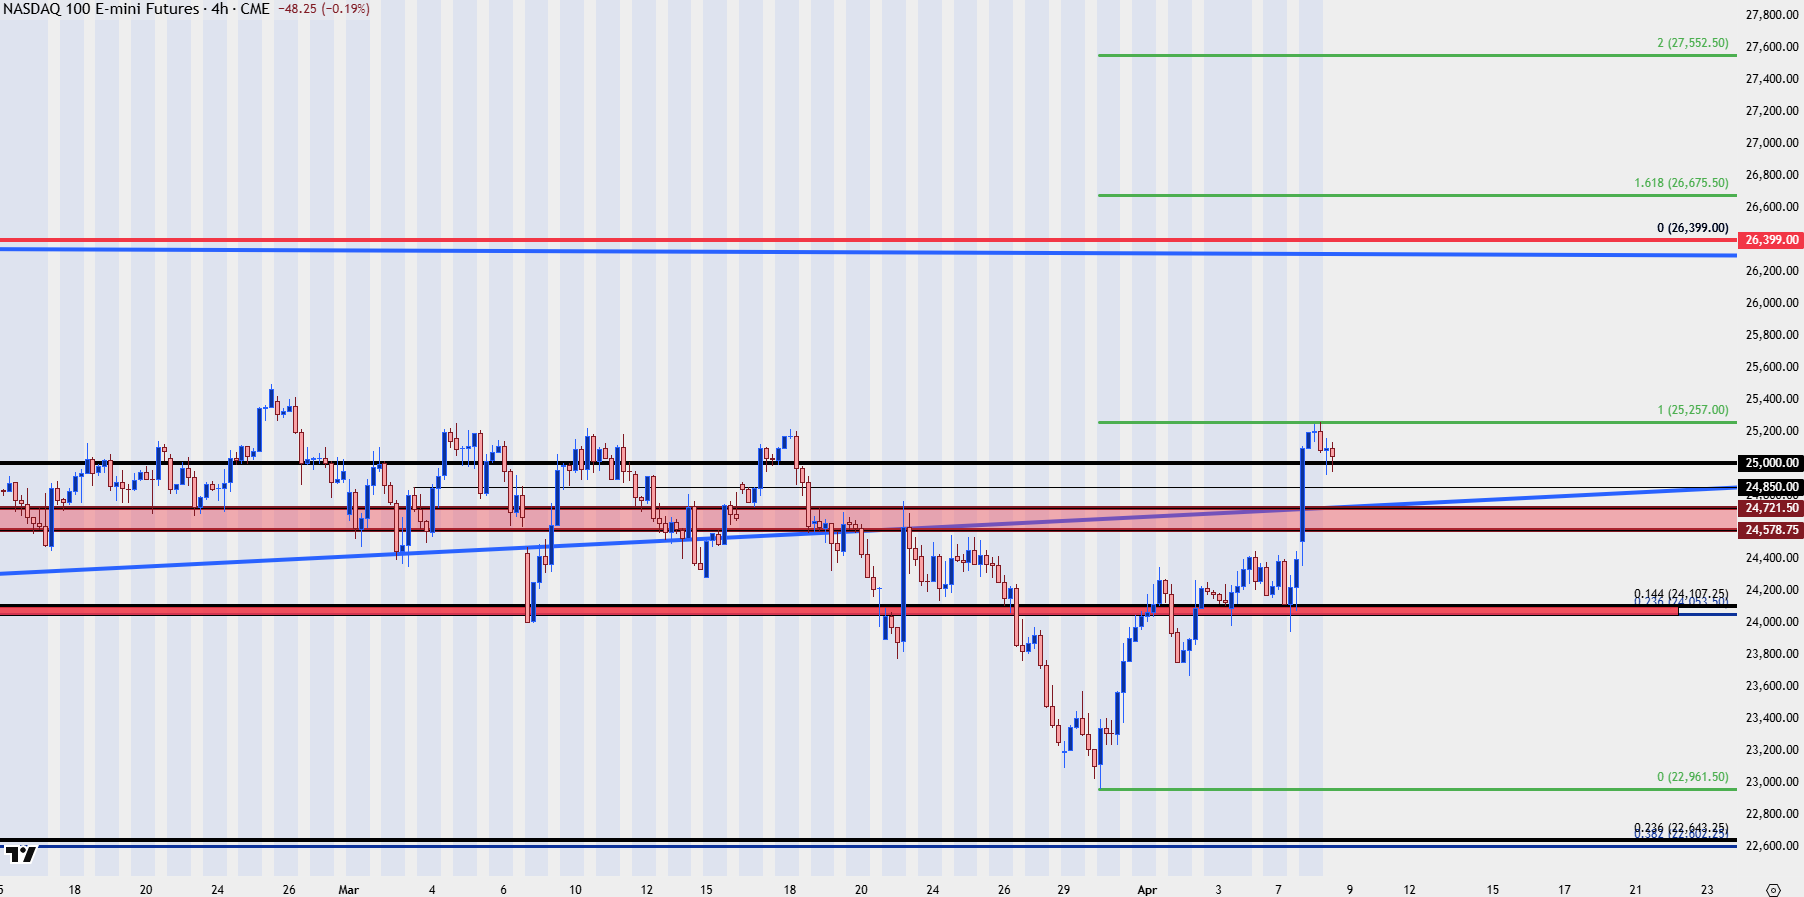
Chart prepared by James Stanley; data derived from Tradingview
--- written by James Stanley, Senior Market Analyst, Global Macro