
From its recent lows, the SPX index has recovered nearly 5% over the past two weeks of trading and continues to maintain a consistent bullish bias, moving steadily closer to its all-time highs. For now, a rebound in market confidence—driven by the decline in safe-haven assets and optimism surrounding a potential Santa Rally, a common seasonal pattern in the final month of the year—has supported this recovery. As long as there are no surprises from the U.S. Federal Reserve, this renewed confidence may continue to reinforce sustained buying pressure in the sessions ahead.

Is Risk Appetite Returning?
After several weeks of uncertainty regarding the Federal Reserve’s final decision of the year, the market now expects a rate-cutting stance for the December 10 meeting, with forecasts pointing to a 0.25% reduction. This expectation has helped improve sentiment toward the SPX, as lower future rates imply cheaper borrowing costs for consumption and investment—factors that generally support demand for risk assets.
Lower rates also weaken safe-haven assets such as the U.S. dollar, particularly as Treasury bond demand declines and reduces foreign capital inflows. As the dollar has lost ground, part of this capital has shifted toward risk assets like the SPX. This coincides with the recent weakness of the DXY index, which has fallen below 100 points, while the SPX has simultaneously recovered. At the moment, both assets maintain a negative coefficient correlation (-0.39), reflecting the inverse relationship between the dollar’s weakness and the SPX’s strength. Correlation coefficients may vary over time.

Source: StoneX, TVC, Tradingview
Adding to this, the year-end season brings the well-known Santa Rally, an event tied to institutional portfolio rebalancing, short-covering, and fiscal adjustments that free up capital for investment heading into 2026. This dynamic tends to boost demand for risk assets like the SPX, reinforcing the short-term recovery in confidence.
Altogether, the SPX’s bias remains firmly bullish, and this may continue as long as safe-haven assets stay weak and the market views the closing weeks of 2025 favorably. If these conditions persist, buying pressure could continue to dominate SPX movements in the sessions ahead.
Long-Term Perspective
While short-term confidence in the SPX has strengthened, long-term sentiment remains cautious. According to the AAII Sentiment Survey, for the week ending November 26, bullish sentiment came in at 32.0%, neutral sentiment at 25.3%, and bearish sentiment remains dominant at 42.7%, indicating uncertainty in the outlook for the next six months.
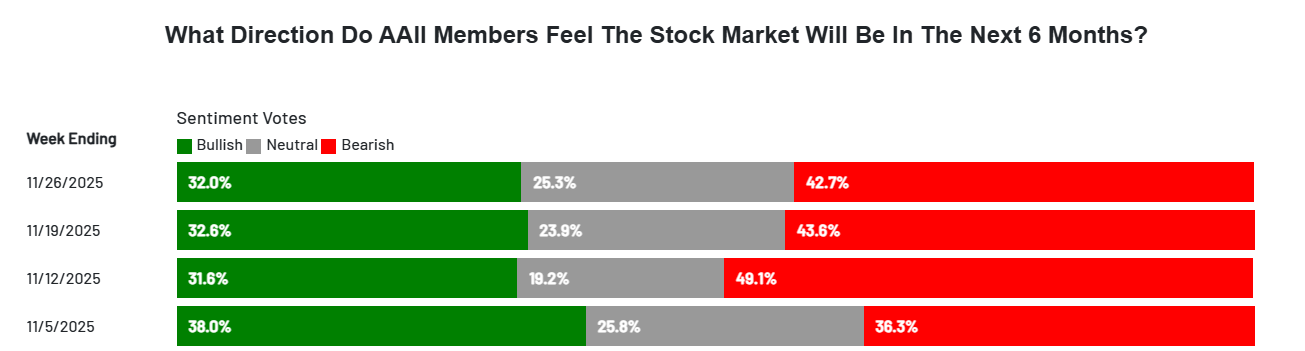
Source: AAII
Without structural catalysts that support sustained equity demand, confidence may remain fragile. Although short-term optimism is evident, it could fade quickly if negative sentiment persists. In that scenario, the lack of robust long-term confidence could weigh on demand for indices such as the SPX, potentially leading to stronger selling pressure in the coming months as long-term sentiment fails to recover heading into the end of 2025.
S&P 500 Technical Outlook

Source: StoneX, Tradingview
- A Sideways Range Still Dominates: Despite the SPX’s recent rebound, the index continues to trade within a medium-term sideways range, capped at 6,900 points and supported at 6,500 points. So far, directional movements have not been strong enough to break either boundary, keeping the broader technical outlook neutral. As long as this range remains intact, it will be difficult for a clear dominant trend to emerge in the near term.
- RSI: The RSI line maintains an upward slope and oscillations above the 50 zone, indicating that buying momentum has begun to gain dominance. If this behavior continues, it could reinforce stronger buying pressure in the SPX in the short term; however, it is important to note that this momentum is now facing nearby resistance levels that may limit further upside.
- TRIX: The TRIX line continues to move very close to the zero level, suggesting that exponential moving averages remain in a neutral bias. If the indicator fails to show a clear recovery, a period of price indecision could emerge in the medium term, making it difficult for a more dominant bullish trendline to develop.
Key Levels:
- 6,919 points – Major Resistance: This level corresponds to the historical highs and represents the most important short-term bullish barrier. A sustained close above this level could open the door to new highs and support the formation of a fresh short-term uptrend that breaks the current sideways range.
- 6,740 points – Nearby Barrier: This zone aligns with a recent pullback area and the 50-period moving average. New price swings toward this level could signal a period of indecision, reinforcing the dominant sideways structure.
- 6,526 points – Key Support: This level marks the most recent lows. If price revisits this area, it could indicate a structural shift in the chart, especially if movements remain below the 50-period moving average, opening the way for a consistent bearish bias into the end of the year.
Written by Julian Pineda, CFA, CMT – Market Analyst
Follow him at: @julianpineda25