
US Dollar, FOMC Key Points
- The Fed’s September 2024 and 2025 interest rate cuts took place against an eerily similar economic backdrop.
- However, this time around, the risks of stagflation are substantially higher, making the Fed’s future path more ambiguous and uncertain
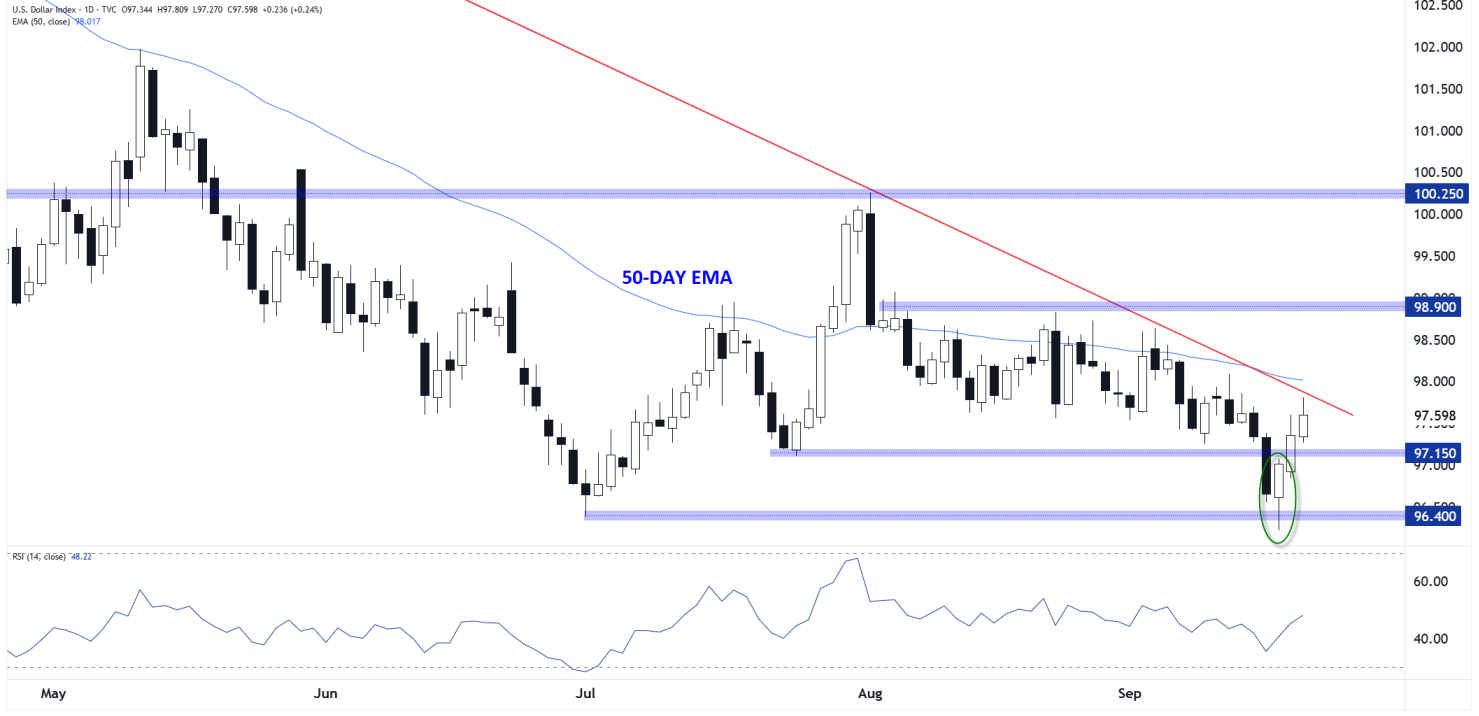
- The US Dollar Index (DXY) is showing (at least near-term) signs of a bottom forming in the wake of the Fed’s interest rate cut.
September 19, 2024: The FOMC’s September 2024 Rate Cut
The Federal Reserve has just delivered its first rate cut in four years, opting for a larger than usual 50bp reduction. Chair Powell framed it as a proactive “insurance cut” to protect against cooling labor conditions, though with the unemployment rate at a still-low 4.2% and Core PCE slightly above the central bank’s target at 2.7%, some traders are skeptical that such a move was needed.
The Summary of Economic Projections (SEP) pointed to two additional cuts in 2024 and two more in 2025. Markets, however, were more dovish, pricing three cuts by year-end and four in 2025.
In the initial market reaction, Treasury yields dipped, but Fed Chairman Jerome Powell’s press conference pushback against aggressive easing expectations prompted traders to reconsider, stemming the decline in yields.
September 18, 2025: The FOMC’s September 2025 Rate Cut
The Federal Reserve has just delivered a 25bp rate cut, continuing its cautious pivot as the labor market shows signs of strain. Chair Powell described the move as a “risk-management cut,” noting the need to support employment even as inflation remains sticky, with the unemployment rate at 4.3% and Core PCE running at 2.9%, still notably above the Fed’s 2% target.
The Summary of Economic Projections (SEP) pointed to two additional cuts in 2025 and one more in 2026. Markets, however, again leaned more dovish, nearly fully pricing three cuts in 2026.
In the immediate aftermath, Treasury yields initially touched their lows but rebounded as Powell pushed back against expectations for a faster pace of easing, underscoring that there was no broad support within the Committee for a larger 50bp cut.
|
Dynamic |
September 2024 |
September 2025 |
|
Cut Size |
50bps |
25bps |
|
Inflation Backdrop |
Disinflation, lower projections |
Inflation sticky, tariffs still a risk |
|
Labor Backdrop |
Cooling but not collapsing |
Clearer labor market weakness |
|
Fed Dots |
2 more in 2024, 2 in 2025 |
2 more in 2025, 1 in 2026 |
|
Market Pricing |
3 in 2024, 4 in 2025 |
~3 in 2026 |
|
Powell tone |
“Insurance” cut |
“Risk management" cut |
|
Dissent |
None |
Miran for 50bps |
|
Immediate Market Reaction |
US Dollar dips, recovers |
US Dollar dips, recovers |
An eerie episode of history repeating…or is it?
History Only Rhymes: Key Contrasts between 2024 and 2025
Despite the superficial parallels (the first rate cut in an extended period, similar “insurance”/”risk management” framing, a deteriorating jobs market with inflation still above target, skeptical markets, etc), these two September rate cut decisions diverge in several important ways.
For one, the 2024 FOMC rate cut took place against a backdrop of disinflation toward the Fed’s 2% target, whereas inflation has been sticky, if not outright rising, above 2% this time around. Likewise, the 2025 labor market is objectively in a worse state, coming off a 22K NFP reading (vs. 142K in 2024).
Put simply, the risks of stagflation in 2025 are substantially higher, making the Fed’s future path more ambiguous and uncertain. This complexity raises the importance of economic data and increases the likelihood of market volatility in the coming months.
Back in 2024, a strong NFP report for September (254K vs. 140K expected, wages +0.4% m/m, unemployment rate down to 4.1%) showed that markets were overly dovish and supported the greenback. Jerome Powell and Company will be hoping we see a similar development this time around, making their decisions for the rest of the year and beyond clearer.

US Dollar Technical Analysis: DXY Daily Chart
Source: StoneX, TradingView
Turning our attention to the chart, the US Dollar Index (DXY) is showing (at least near-term) signs of a bottom forming in the wake of the Fed’s interest rate cut. The index formed a clear bullish “Piercing Candle” on Wednesday, following through with additional buying pressure both yesterday and so far today.
However, amidst these near-term bullish developments, the dollar index is running approaching resistance from the bearish trend line off the year-to-date high, as well as the declining 50-day EMA. The combination of price action around this level and fundamental economic data over the next couple weeks may determine the direction of the US dollar for the rest of the year, and potentially beyond.
-- Written by Matt Weller, Global Head of Research
Check out Matt’s Daily Market Update videos on YouTube and be sure to follow Matt on Twitter: @MWellerFX