


US Dollar Talking Points:
- US inflation showed another drawdown this morning and this led to a continuation of US Dollar weakness, with DXY testing below the 101 level and setting a fresh yearly low.
- The question now is one of continuation and whether USD bears can hold the move through the end of the week.
- This article includes an archived webinar from today. You’re welcome to join these in the future as they’re hosted every Tuesday at 1PM ET. Click here to register.
US inflation continues to head lower, and this morning brought another iteration of that theme to markets. The US Dollar was already beset by weakness after reversing from confluent resistance last Thursday, and this morning’s data gave bears another shot-in-the-arm, helping to drive the currency to a fresh yearly low.
At this point, bears have an open door as this support breach has both nullified a double bottom pattern while also opening the door for a descending triangle to begin filling in. The question of continuation will remain through the end of the week, as a failure from bears to drive could allow for an underside wick on the weekly bar at a key point of support, which could keep the door open for bullish reversal potential. So, this remains a key spot, even after the breakout.
For now, the focus is on bears and whether they can run this fresh breakout. The next spot of support in DXY is around the 100 psychological level which hasn’t been in-play since April of last year.
US Dollar - DXY Daily Price Chart (indicative only, not available on Forex.com platforms)
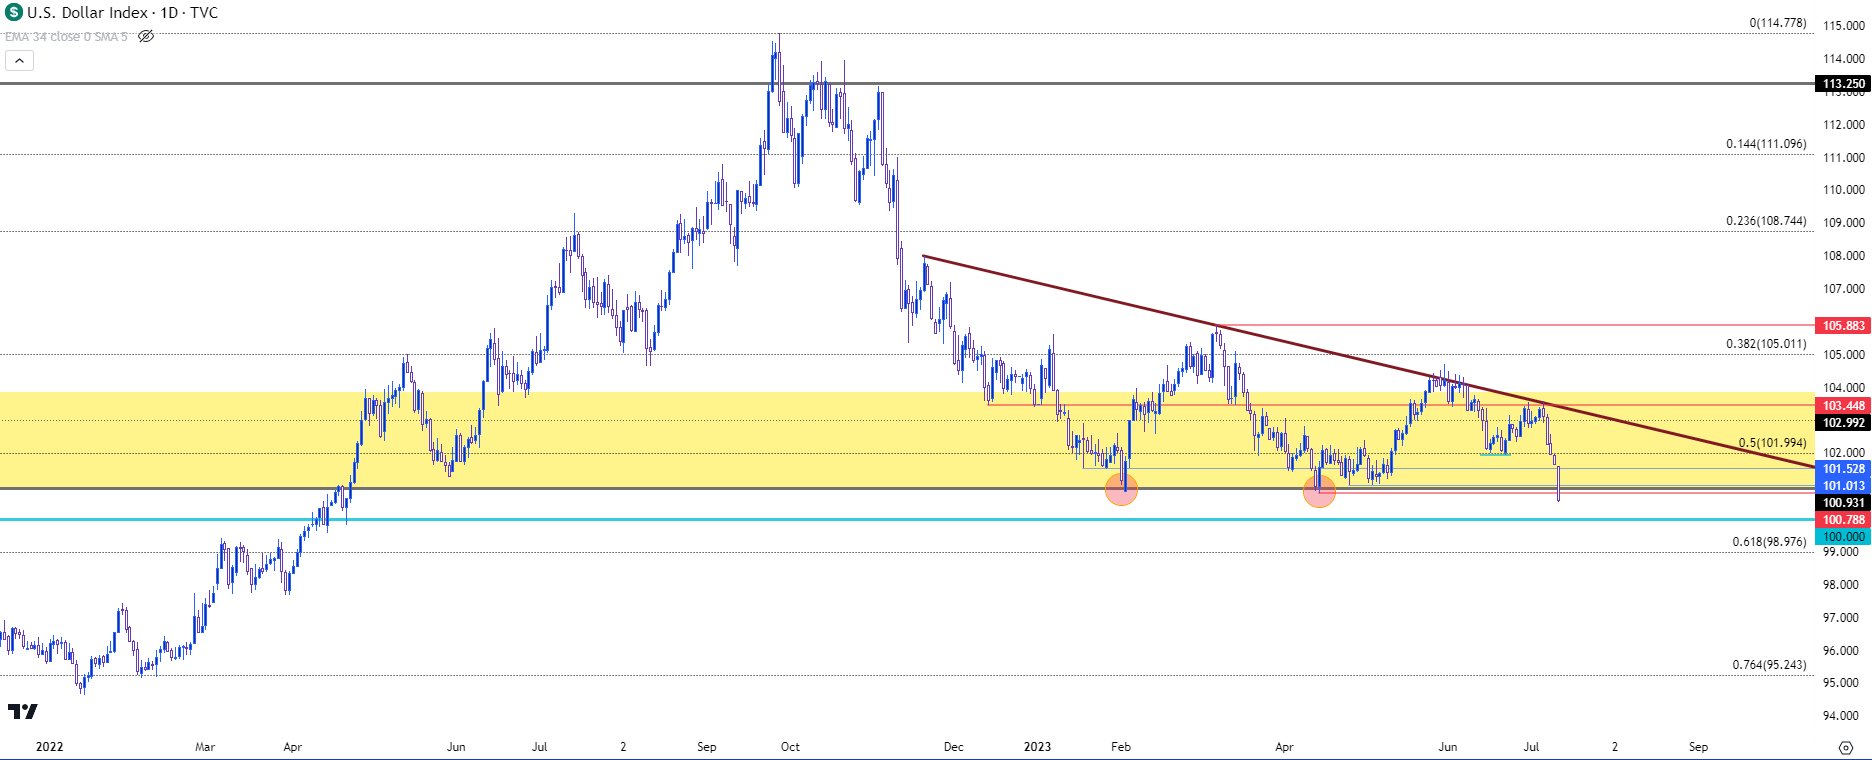 Chart prepared by James Stanley; data derived from Tradingview
USD Longer-Term
From the weekly chart below, we can see the importance of this area on the chart. Bears have already been stifled at this same spot twice in 2023 trade. But, now that they’ve been able to break the seal, the big question is whether there’s enough bears not yet in the move that can come in to continue driving the trend. This may have some bearing from a similar question on EUR/USD which I’ll look at below.
US Dollar - DXY Weekly Price Chart (indicative only, not available on Forex.com platforms)
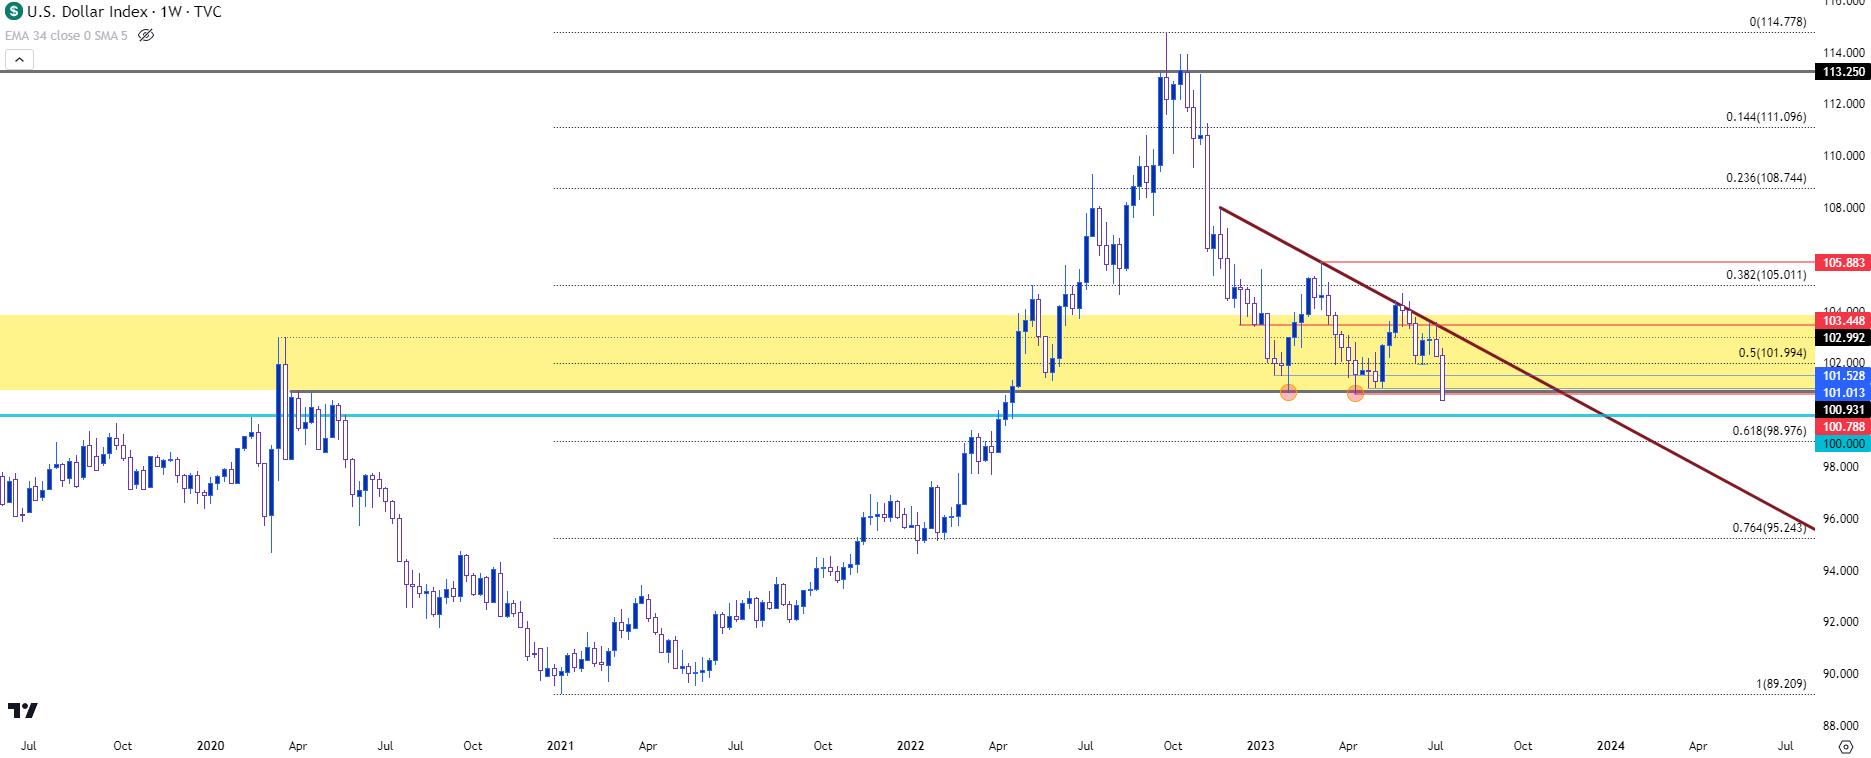 Chart prepared by James Stanley; data derived from Tradingview
EUR/USD Breakout – but Does it Fake Out on the Weekly?
EUR/USD makes up a whopping 57.6% of the DXY quote, so in many cases a break in the USD will have an associated, mirror image scenario in EUR/USD, and that’s what’s shown so far today as EUR/USD is testing a yearly high above the 1.1100 handle.
This has been a tough level for EUR/USD bulls as there’s been multiple episodes of failure already in the 1.1000-1.1100 zone, and similar to the 100.87 level in DXY above, the seal was finally broken earlier this morning. The big question now is whether bulls can continue to drive it, and like USD above, that will remain a question mark until the close of this week’s bar.
From the weekly chart below, we can see the pair breaking ground that hasn’t been touched for more than a year, and bulls now have their shot to continue driving. The next level of resistance that I’m tracking is a prior swing around 1.1186, and for support, there’s quite a bit given how long that grind in the 1.1000-1.1100 zone lasted. But, the way the weekly bar closes could be telling as to how well this breakout has been digested by markets, and a failure to hold above resistance could keep the door open for reversal potential.
EUR/USD Weekly Price Chart
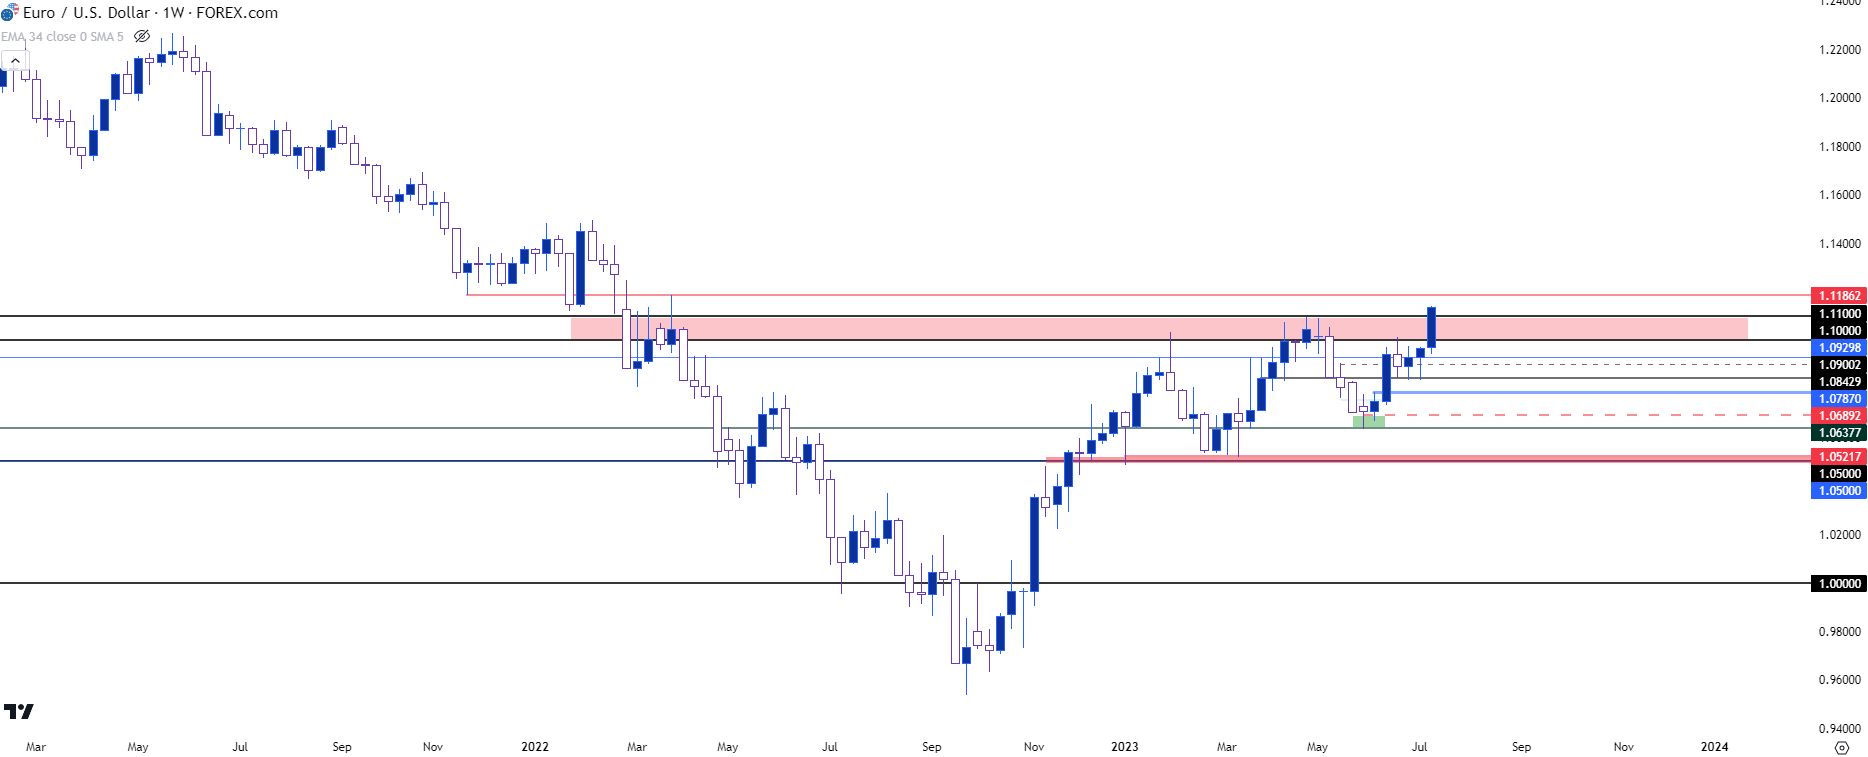 Chart prepared by James Stanley, EUR/USD on Tradingview
--- written by James Stanley, Senior Strategist





