


US Dollar, EUR/USD, USD/CAD, USD/JPY Talking Points:
- Tomorrow brings US CPI data to markets and the US Dollar has been mired with a deluge of sellers since running into resistance last Thursday.
- EUR/USD has pushed up for another re-test of 1.1000 resistance on the back of that USD weakness, which also brings questions to the bullish theme in USD/JPY. USD/CAD will be in the crosshairs tomorrow as there’s a Bank of Canada rate decision scheduled for an hour and a half after the release of US CPI.
- This article includes an archived webinar from today. You’re welcome to join these in the future as they’re hosted every Tuesday at 1PM ET. Click here to register.
The US Dollar has been battered after running into confluent resistance last Thursday. The test was at 103.45, which was also aligned with a bearish trendline that USD bulls probably won’t soon forget about as it’s now had two episodes of reversal in DXY over the past couple of months.
The Thursday resistance inflection led to the Friday NFP report, which spurred a strong sell-off in the Greenback, which came along with a strong bullish push in the EUR/USD pair. So far this week, the USD has been beset by even more weakness, helping EUR/USD to re-test the same 1.1000 area that proved as rigid resistance back in April and May.
With the release of CPI data on the cards for tomorrow, the big question is whether EUR/USD bulls can muster the gumption to craft a breakout to fresh yearly highs, which could possibly include a bearish scenario for the USD.
At this point, the US Dollar has slid below a key support level at 102, which had helped to hold the low during June trade. Price is fast approaching the next spot of support around 101.53, but really, it’s the 101 level that sticks out, with the 100.87 spot below that. The 101 level had helped to hold a higher-low in April, which kept the door open to that bullish theme that eventually brought on a trendline re-test. And below that the 100.87 level marks a double bottom formation as there’s been two touches at that price, in February and then April.
A breach of that support nullifies the double bottom formation, but it also triggers a descending triangle that’s remained alive on the basis of that trendline hold.
But, given how weak the USD has been the big question is one of continuation.
US Dollar - DXY Weekly Price Chart (indicative only, not available on Forex.com platforms)
 Chart prepared by James Stanley; data derived from Tradingview
EUR/USD
Regarding that continuation potential in the US Dollar bearish theme, there’s a relevant related question in EUR/USD and whether bulls can do what they haven’t yet been able to do this year, which is produce a print above the 1.1100 handle.
There’s been multiple attempts, especially in April and May. I talked about this in the webinar, highlighting some key levels within the 1.1000-1.1100 zone that remain of interest.
But, at this point, price is showing as a doji on the daily chart right at the 1.1000 handle. This is around the area where bulls have started to see turbulence in the past, so the big question is whether buyers can/will show up above 1.1000 to continue supporting the move.
Tomorrow’s CPI report is an obvious opportunity for such to happen, but perhaps the more interesting item is what happens if bulls can force the breakout – but they can’t hold the move. This could raise the prospect of reversal scenario, which could carry some relevance to the USD matter investigated above.
EUR/USD Daily Chart
 Chart prepared by James Stanley, EUR/USD on Tradingview
USD/CAD
USD/CAD could be busy tomorrow, as the US CPI print at 8:30 AM ET leads into the Bank of Canada rate decision at 10 AM ET.
The BoC shocked last month when they hiked rates, helping USD/CAD to violate the range that had been in-place for much of the eight months prior. That BoC hike combined with Fed and ECB rate decisions a week later helped to push USD/CAD to a fresh low, but sellers started to slow as price neared the 1.3100 handle. That led to the build of a falling wedge formation, and a bullish reversal began to show soon after.
That theme was looking strong to the upside until last Friday, when the NFP release and Canadian jobs numbers fired a strong reversal, leading to a bearish outside bar on the daily chart. So far this week, that theme has continued with sellers pushing, but price remains above a couple of key supports that could keep the door open for bullish potential.
That support would be around the 1.3200 handle, and it would need to be defended by bulls through both of tomorrow’s drivers to keep the door open for topside themes. Otherwise, the recent sequence of higher-lows would be broken and bullish scenarios would come into question.
USD/CAD Four-Hour Price Chart
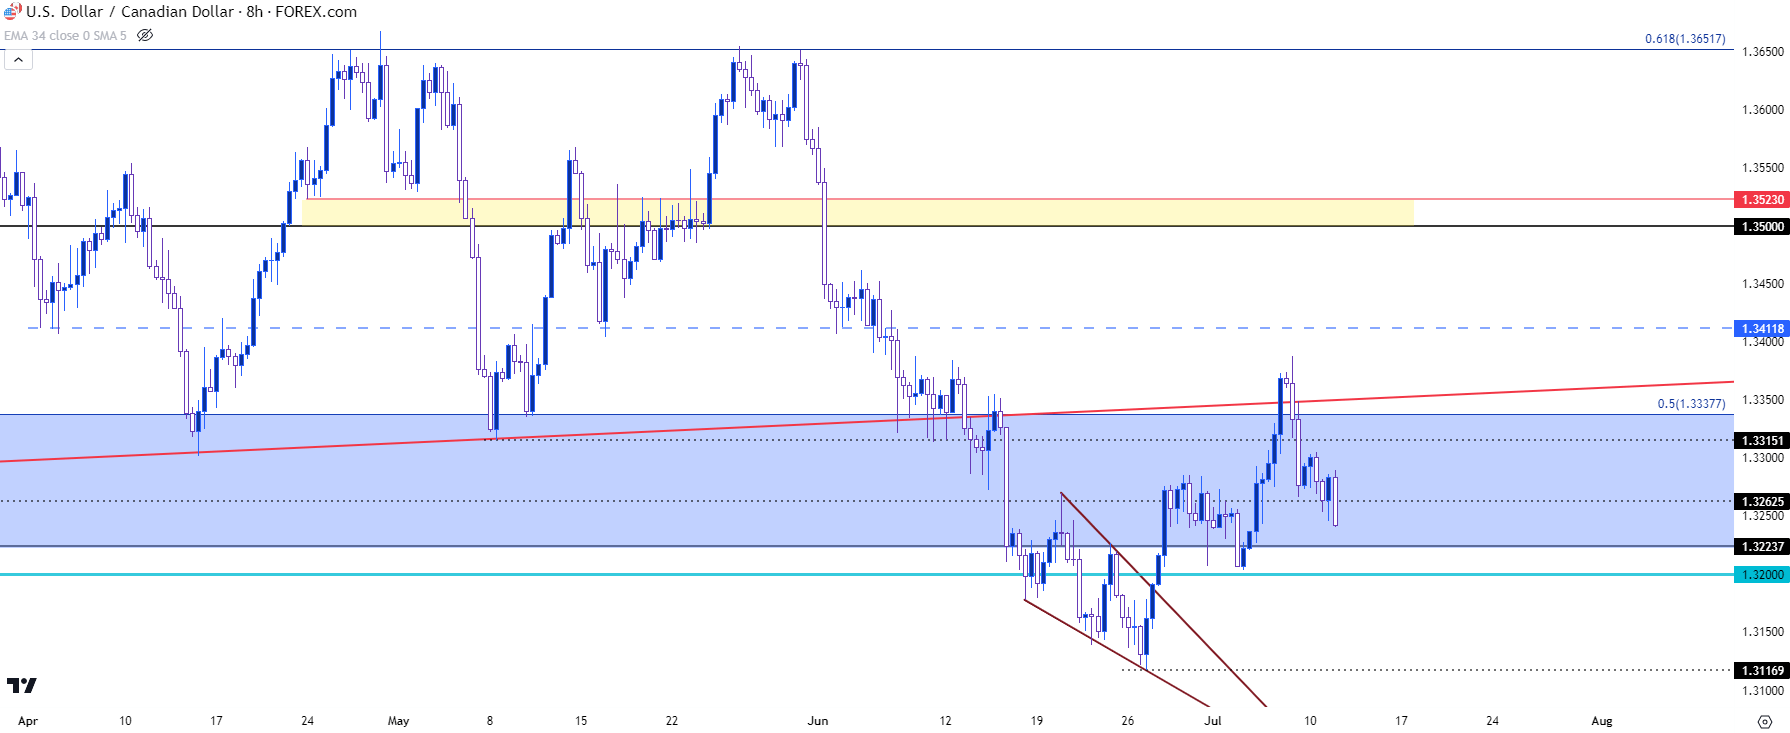 Chart prepared by James Stanley, USD/CAD on Tradingview
USD/JPY: Reversal Finds Support
USD/JPY ran into a major psychological level last week at 145 and this was the same spot that stalled the move last year for about a month. But – it didn’t reverse the bullish trend, as there was another topside extension that played out in Q4 of last year with price eventually testing (and failing) above the 150 handle.
The more recent re-test of 145 started to shake last week after a hold below the big figure, which opened the door to a series of lower-highs which, eventually, was matched with lower-lows.
Now, price has already fallen down to the next major psychological level around the 140 handle, with support showing just above that at 140.30, which is the 23.6% Fibonacci retracement of the same major move that helped to mark the low in January of this year. I extrapolated on that quite a bit in the webinar, and bulls may not be done yet in USD/JPY but there would likely need to be some bullish response in DXY to turn the tide of that recent bearish trend in the pair.
That Fibonacci sequence shows best on the weekly chart below, with emphasis on the 23.6% level at 140.30.
USD/JPY Weekly Price Chart
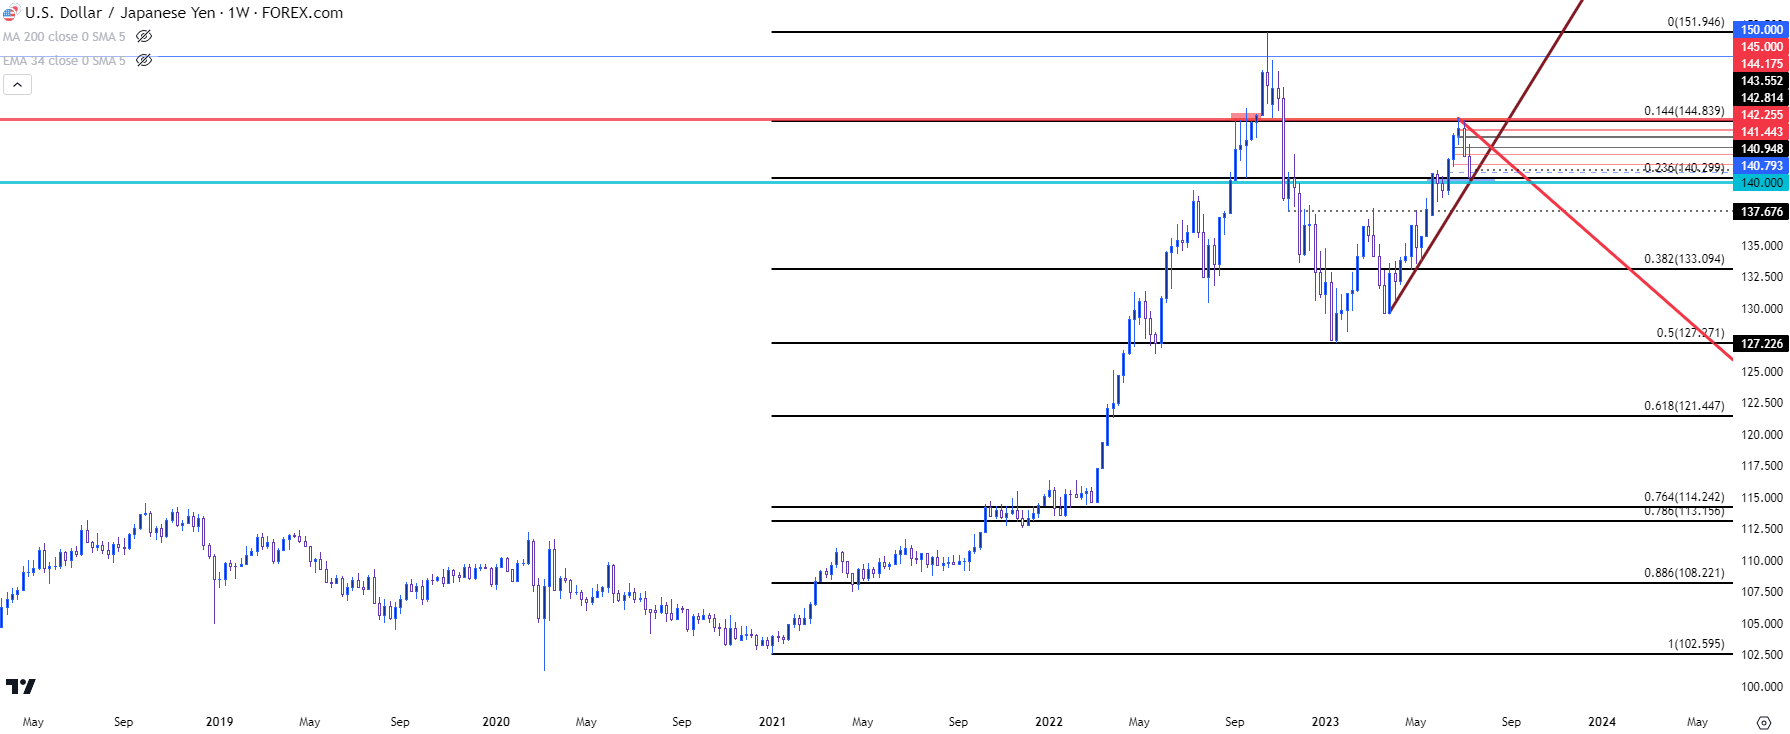 Chart prepared by James Stanley, USD/JPY on Tradingview
--- written by James Stanley, Senior Strategist






