


- Trump flags “Project Freedom” while talking up negotiations with Iran
- Recent Loonie strength driven by risk appetite, not rate differentials
- Hammer after extended drop warns of reversal risk
“Project Freedom” boosts risk Loonie
USD/CAD has opened the week on the back foot having closed at the lowest level since early March on Friday, hit by another well timed Truth Social post from Donald Trump late Sunday just ahead of the Globex reopen, lifting risk sentiment and weighing on the US dollar.
Trump flagged plans to guide ships out of the Strait of Hormuz starting Monday while again talking up “very positive” discussions with Iran, delivering an optimistic assessment seen repeatedly in early Asian trade since the war began in late March. Whether the initial moves will stick is another matter, however.
There is no detail on how “Project Freedom” will work, whether shipping firms and insurers take part, or whether Iran will even allow it. Only hours earlier there were unsubstantiated reports of Iran laying mines in the Strait again, so headline risk remains elevated, especially with Japan and China offline for holidays.
Risk appetite remains dominant driver
Source: TradingView
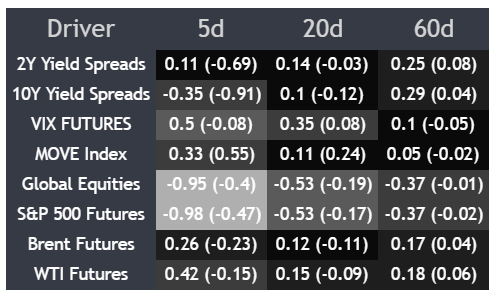
While questions remain, the initial reaction in the Loonie should come as no surprise given clear evidence of what’s been behind the bearish move in USD/CAD recently. With both Canada and the United States major energy producers and yield differentials having mattered little over both the short and longer term, the correlation matrix above reveals a tight inverse relationship with equities, including Vanguard’s Total World ETF and S&P 500 futures, alongside a modest positive link with implied volatility. It suggests the Loonie’s run has been fuelled by risk appetite, not rates.
For now, risk appetite and headlines around the Strait look set to remain in control. Later in the week, US and Canadian employment data may start to influence positioning and hedging flows given the strength in the Canadian dollar, but unless that materially shifts rate expectations, the near-term direction is still likely to hinge on how this latest round of headlines holds up.
Hammer warns bear trend may stall
Source: TradingView
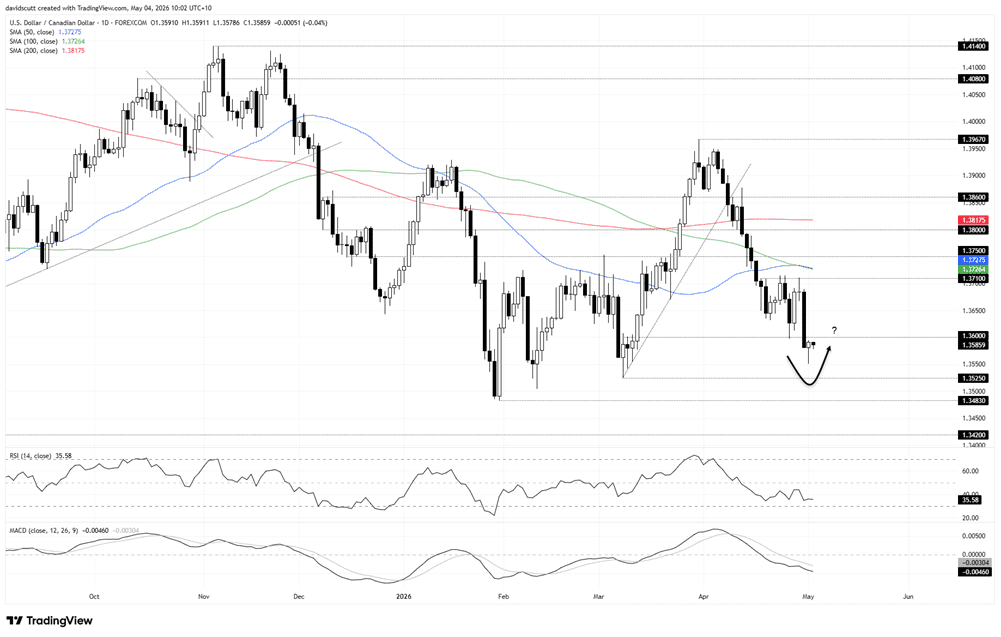
While the current backdrop points to downside risk, the price action in USD/CAD on Friday provided a contradictory signal, with a hammer on the daily timeframe hinting at the start of a potential trend change, especially coming after the prolonged bear move we’ve seen. Earnings optimism looks close to being fully priced, and equities have priced the end of the war more times than one can remember, so there is a narrative building that suggests the signal may be worth paying attention to.
Of course, one hammer candle does not make a bullish trend, so the price action today will be important when it comes to validating or invalidating the signal. 1.3600 looms as the first level overhead that could challenge any bullish revival, having acted as resistance previously before briefly flipping to support last week. Having broken beneath it on Thursday, it may now revert to offering resistance, making it a level to watch when assessing both the bullish signal and potential setups.
An inability to recover 1.3600 would allow for shorts to be set with a stop above for protection, targeting Friday’s low just above 1.3550 initially, with the March nine swing low of 1.3525 and January 30 swing low of 1.3483 as further downside targets. The message from RSI (14) and MACD continues to favour selling into strength, with the former holding beneath 50 while threatening to set fresh lows, like the price, while the latter continues to grind further into negative territory having already crossed the signal line from above.
However, just because the oscillators favour playing the pair from the short side does not rule out looking at longs altogether. If the price can reclaim and hold above 1.3600 into the European open, another setup would be to initiate longs with a tight stop beneath, targeting 1.3710 resistance which capped the pair over the past fortnight. Beyond that, the convergence of the 50 and 100-day moving averages marginally overhead presents a high hurdle for additional upside should the price return to test there.






