- Trump’s recession remarks rattle markets, but warning signs were already in place
- USD/JPY holds trendline support, but downside risks remain
- AUD/USD weakens, testing key moving average as momentum stays bearish
- Nasdaq 100 cracks long-term uptrend—AI mania unwind or just a correction?
Summary
U.S. recession fears rattle markets on Monday, with U.S President Donald Trump’s remarks cited as the spark behind a sharp unwind in riskier assets.
Speaking on Fox News, Trump avoided ruling out a recession, instead suggesting the economy is in a “period of transition” as his administration pushes major policy changes. “I hate to predict things like that. There is a period of transition, because what we’re doing is very big. We’re bringing wealth back to America.”
The comments suggest he’s more tolerant of near-term economic weakness than many had assumed, much like his early approach to the stock market in his second term. Gone are the daily social media posts cheering Dow records, and there’s little sign he intends to shift course to stabilise increasingly volatile markets.
Recession Signals Flashing Amber
While many pointed to Trump’s remarks as the trigger for the risk rout, the warning signs had been flashing well before. Citigroup’s U.S. economic surprise index has been negative since mid-February, signalling a steady stream of weaker-than-expected data even with lowered expectations. The Atlanta Fed GDPNowcast model points to annualised first-quarter growth of -2.4%, reflecting not just tariff uncertainty but broader cracks forming in the labour market. Hardly the sort of backdrop that instils confidence.
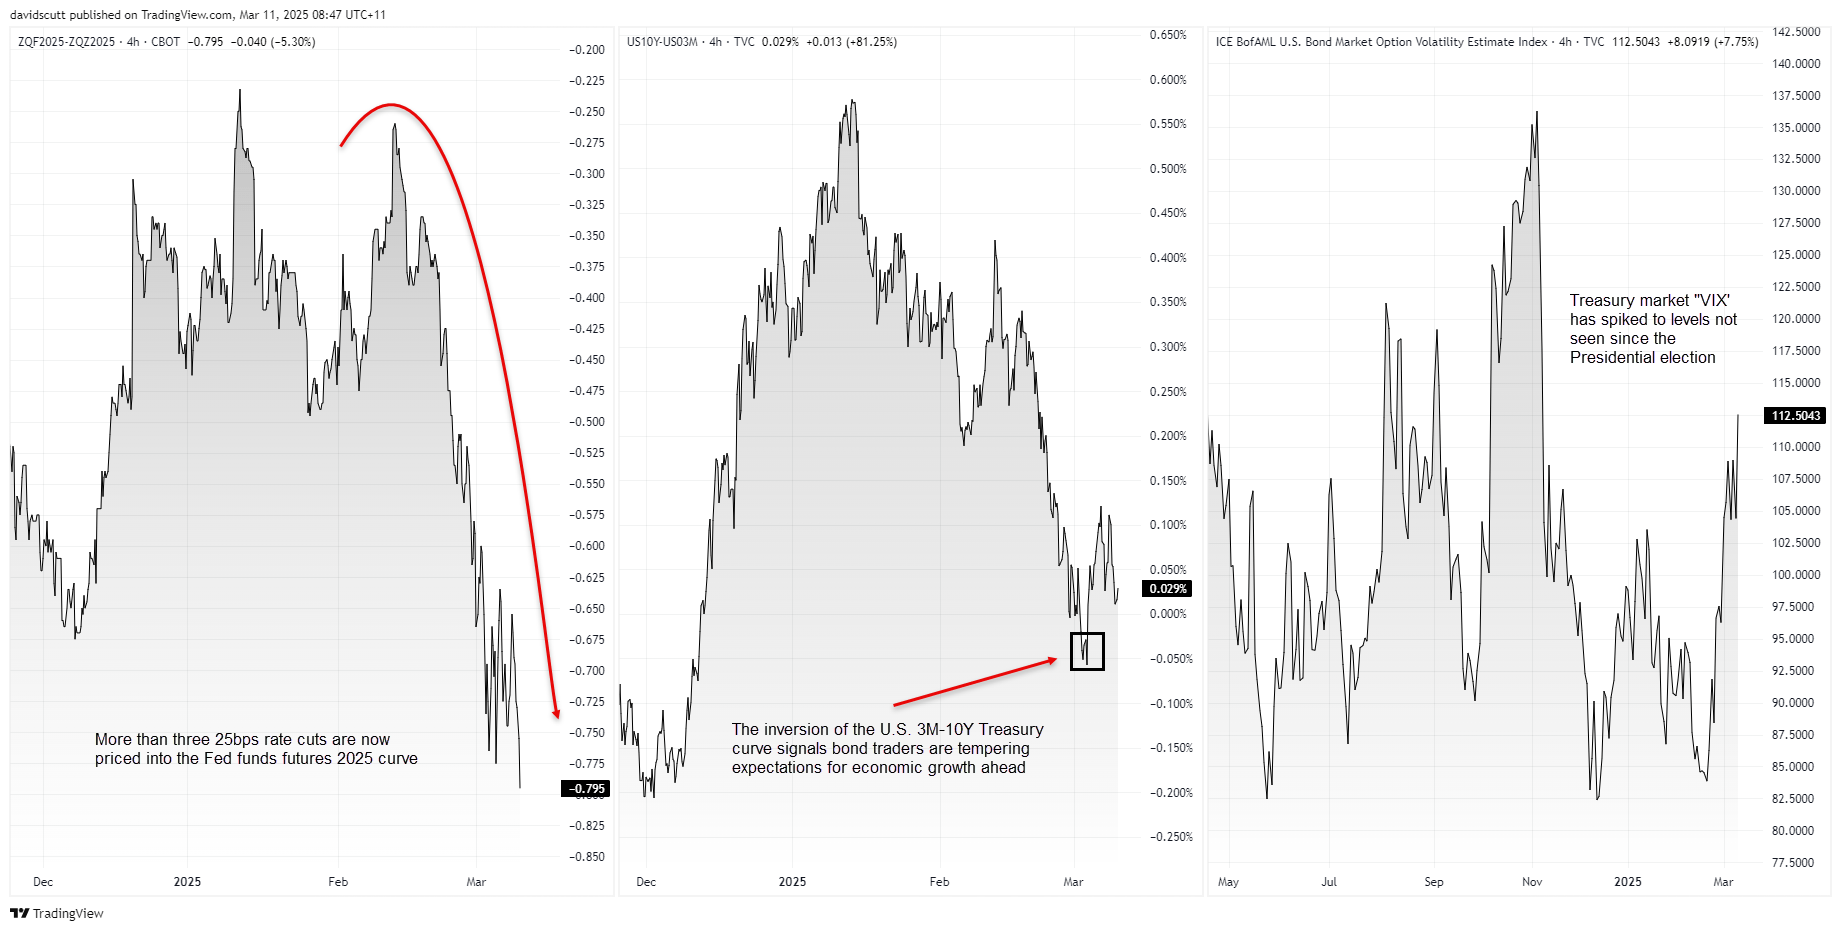
The charts reinforce the growing unease, with Fed funds futures now pricing in more than three full 25bp rate cuts in 2025. The U.S. 3-month/10-year Treasury curve slipped into negative territory earlier this month, suggesting bond traders are bracing for a slowdown. The MOVE index—essentially the bond market’s version of the VIX—has surged to its highest level since the last presidential election, highlighting growing uncertainty.
Source: TradingView
So yes, Trump’s comments may have been the spark, but the fuel had been sitting there for weeks. Encouragingly for traders, the reaction across some markets looked more technical than purely fundamental, suggesting positioning played a role.

FX: Watching USD/JPY and AUD/USD as risk sentiment wobbles
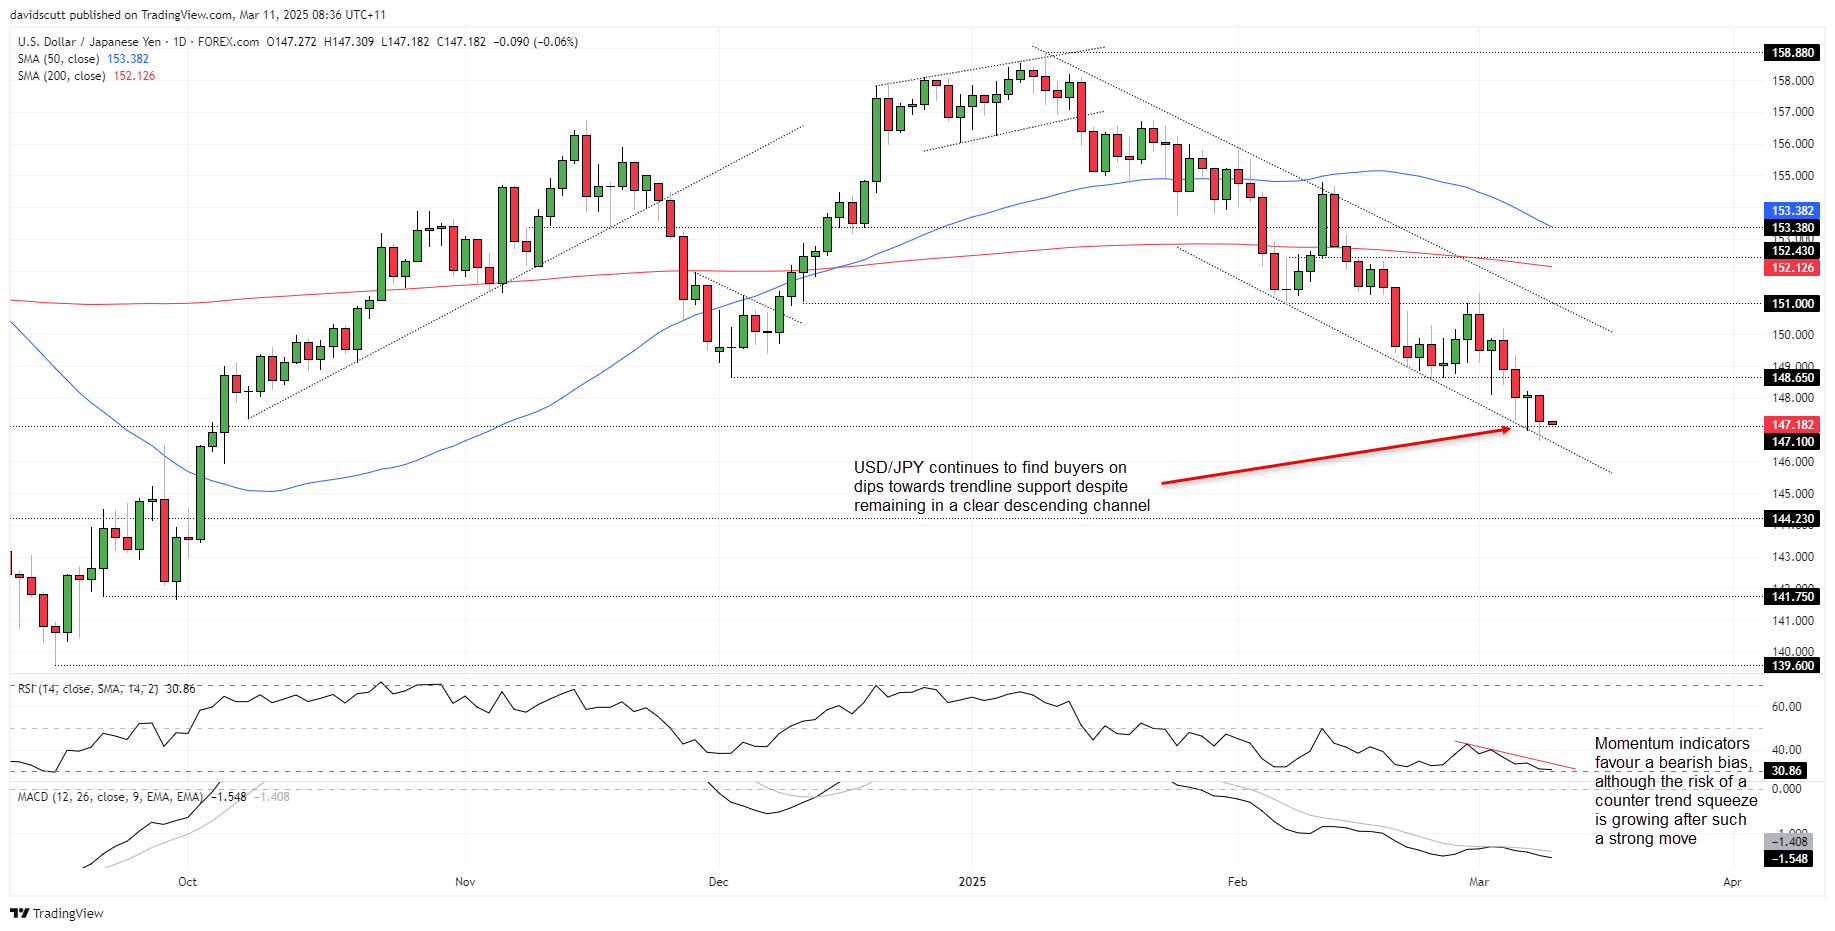
USD/JPY is worth watching today in Asia given its links to risk appetite via yen carry trades, especially as it bottomed well before U.S. equity futures during the North American session. If it starts to slide again, it may be a sign that forced liquidations in riskier asset classes may be on the way.
Source: TradingView
For now, USD/JPY remains locked in a descending channel, bouncing off trendline support on Monday, mirroring Friday’s price action. That and nearby horizontal support are the immediate downside levels to watch, with a break beneath opening the door for a move towards 146, or even 144.23. On the topside, 148 has capped countertrend moves recently, with 148.65 the next layer of resistance after that. RSI (14) and MACD remain firmly bearish, favouring selling rallies and downside breaks.

Source: TradingView
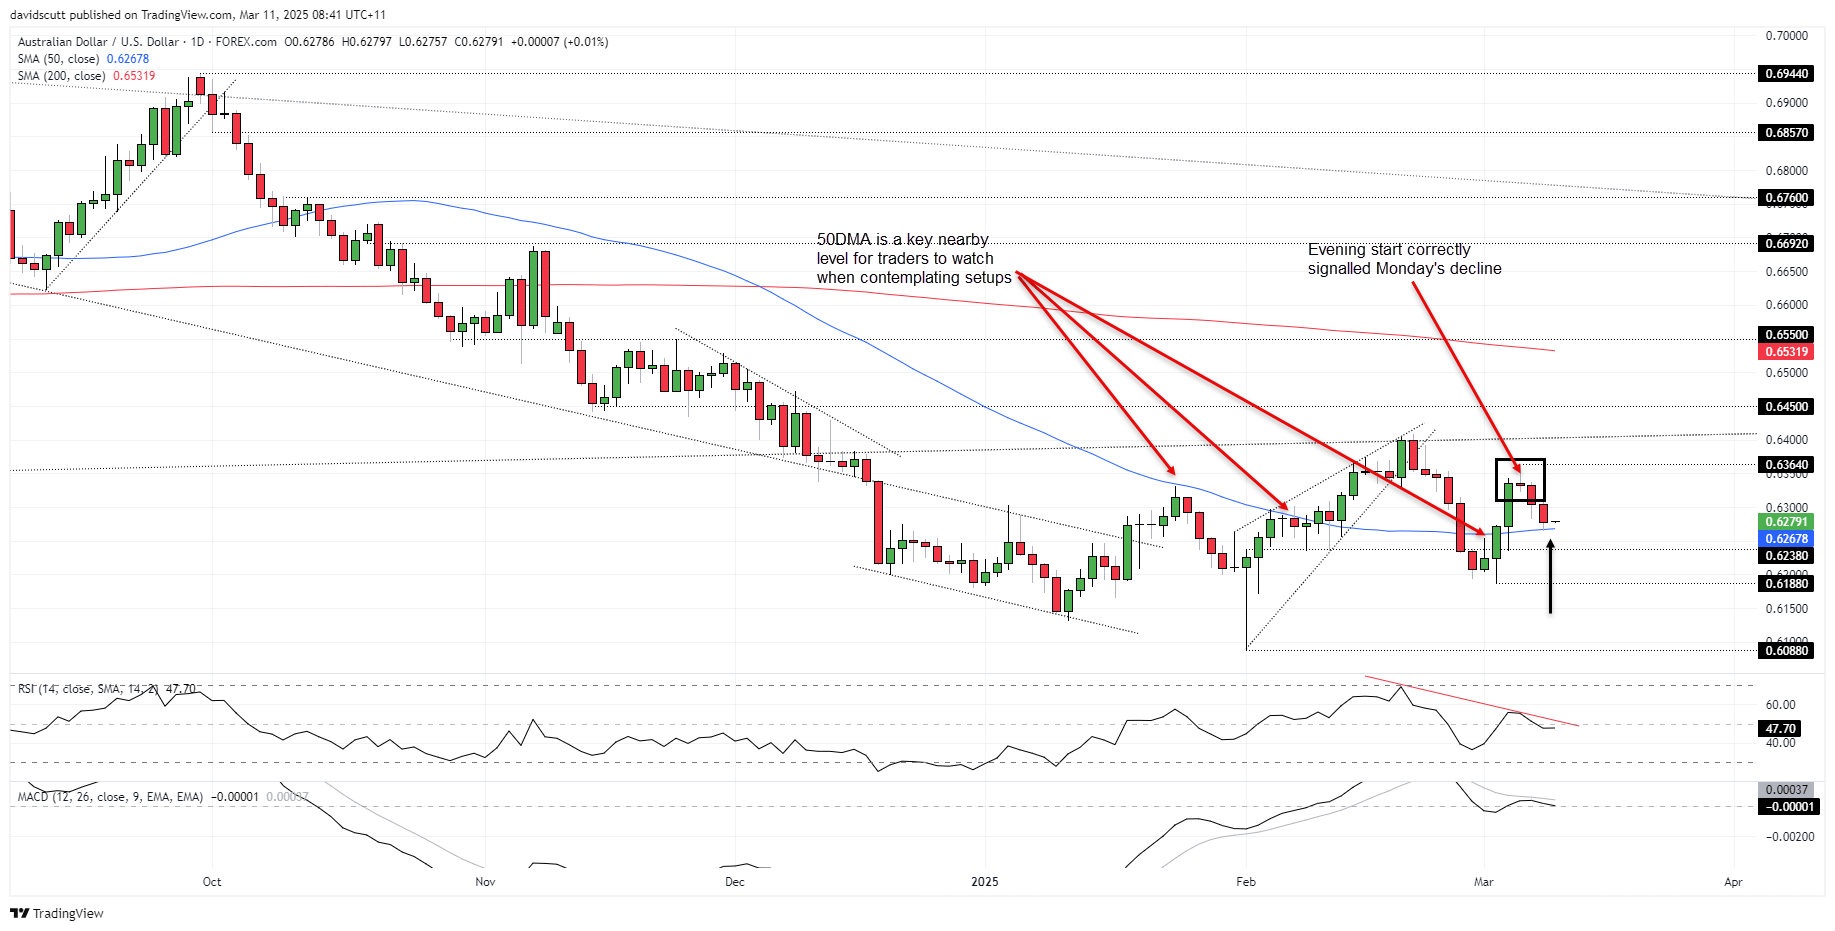
No surprises seeing AUD/USD weaker to start the week, with the three-candle evening star pattern completed Friday correctly signalling further selling on Monday. AUD/USD has been tracking the 50DMA closely in recent months, so the fact that Monday’s slide stalled there is noteworthy. Below, .6238 and .6188 have been in play over the past month. On the topside, .6300 may offer some resistance, but the more interesting level is the swing high of .6364 from March 6. Momentum indicators remain firmly bearish, reinforcing the near-term downside bias.

Nasdaq 100: AI unwind or just a correction?
Nasdaq 100 futures dominated the headlines after the physical index posted its largest one-day drop since 2022, slicing through uptrend support dating back to early 2023—when the AI mania really took off. Given last week’s break below the 200DMA, it raises the question: are we witnessing the unwind of AI euphoria? With recent price action and rising competition from China, the pieces are falling into place for some sort of reset.

Source: TradingView
The early 2023 uptrend sits around 19,900 today, making it and former horizontal support at 19,850 key near-term levels on the topside. Below, the price bounced off minor support at 19,300 overnight, with another minor level at 19,140 sitting just below. A break of the latter could see bears push for a retest of 18,387. Both RSI (14) and MACD are flashing bearish signals, although the latter is now in oversold territory on the daily timeframe—suggesting that while the bias remains tilted to the downside, the risk of a countertrend squeeze is growing after recent heavy falls.
-- Written by David Scutt
Follow David on Twitter @scutty