
The trading week has come to an end and a lack of direction around the yen remains evident in the short term. This can be seen in the performance of USD/JPY over the last three trading sessions, where the pair has recorded moves of barely 0.3%, highlighting a market that continues to develop within a broadly neutral environment.
For now, this cautious tone remains closely linked to uncertainty surrounding U.S. monetary policy. Expectations that the Federal Reserve could maintain a more aggressive stance continue to represent a challenge for the yen, as they keep alive the prospect of a more attractive U.S. bond market. This dynamic continues to support the dollar's relative strength and limits the yen's ability to recover ground consistently. As long as this backdrop remains in place, the current lack of direction could continue to be a relevant feature of USD/JPY price action in the sessions ahead.

Are U.S. Bonds Still Supporting the Dollar?
The week was marked by the release of the latest Federal Reserve minutes, which confirmed that September's rate hike received unanimous support from policymakers. Officials also emphasized that inflationary pressures remain a relevant risk to the U.S. economy.
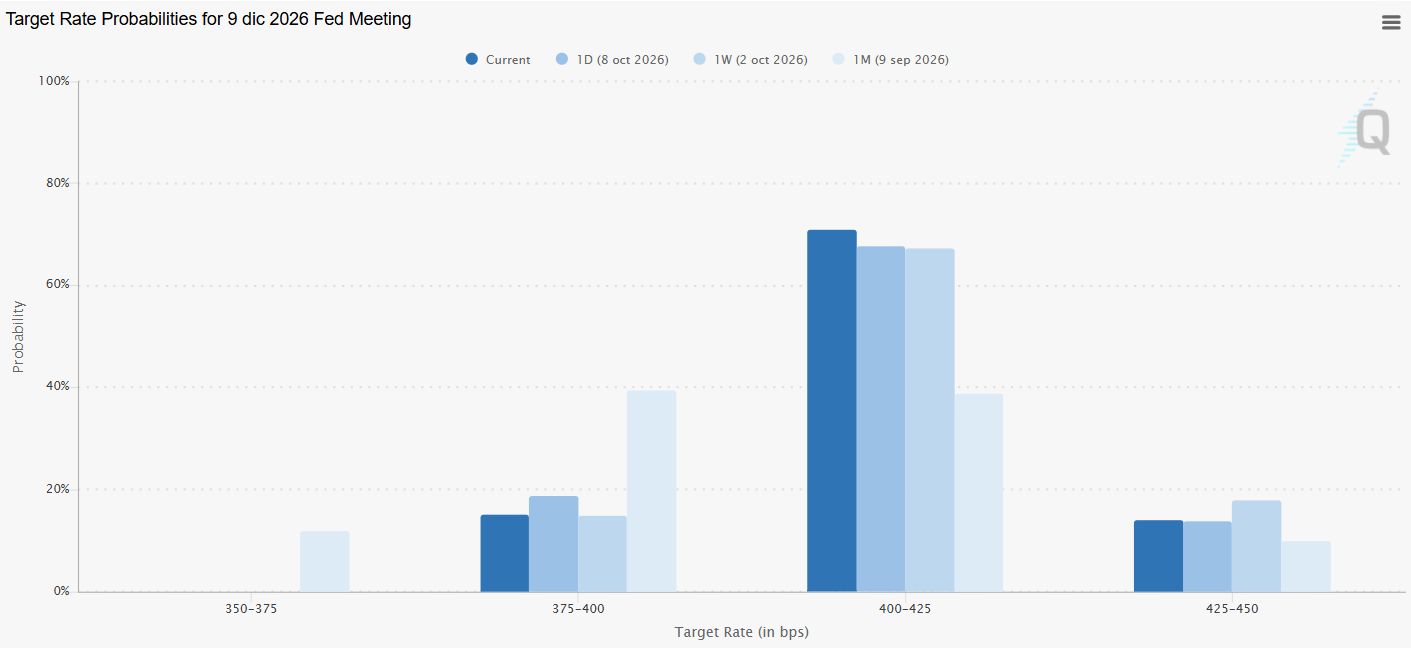
More importantly, the minutes reinforced the possibility of another rate hike before the end of 2026. While markets continue to assign a high probability to no changes at the October meeting, expectations for the December 9 decision have become increasingly significant. Current probability estimates continue to show more than a 70% chance that the benchmark rate could move from the current 4.00% to 4.25% before year-end.
This remains important because, while the Federal Reserve continues to leave the door open to further tightening, the Bank of Japan maintains a considerably more cautious stance. Expectations still point to very limited changes around Japan's current 1.5% benchmark rate, a situation that is once again beginning to favor the U.S. dollar through the interest-rate differential between both economies.
Source: CMEGROUP
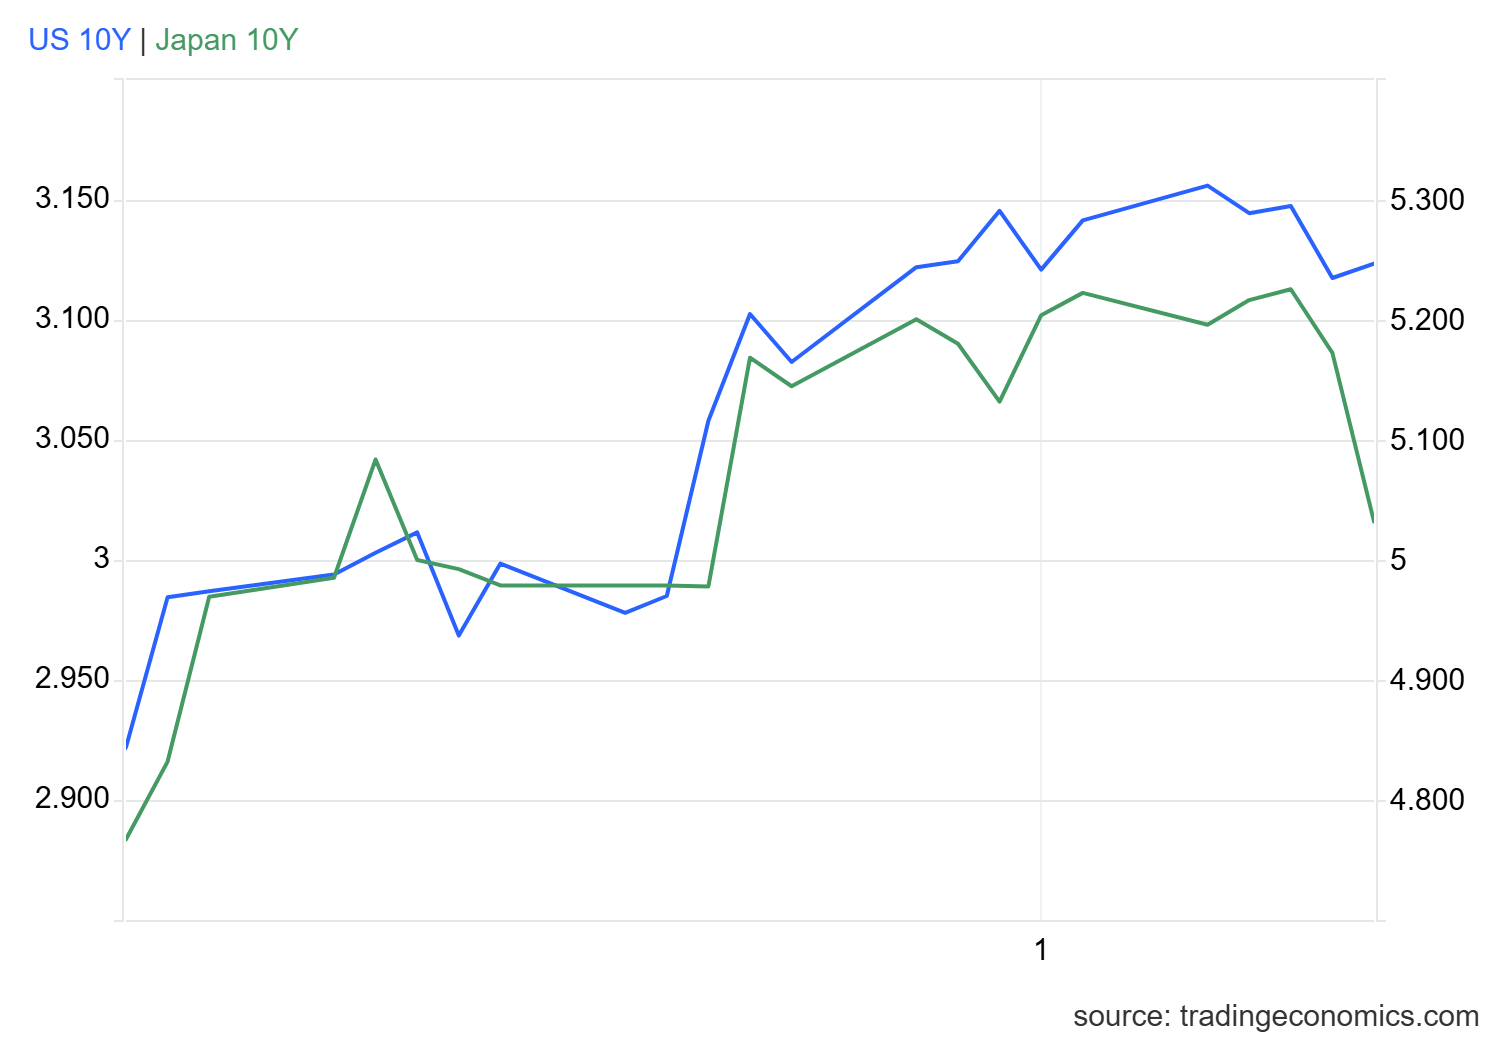
This divergence is also becoming more visible within the bond market. In Japan, 10-year government bond yields have continued to moderate and are moving closer to the 3.0% area. By contrast, U.S. 10-year Treasury yields remain around 5.2%, levels not seen in decades.
This difference is important because it highlights the relative attractiveness that dollar-denominated assets continue to maintain compared with yen-denominated investments. It is also closely linked to the different monetary policy outlooks of both central banks and continues to support capital flows toward U.S. assets.
Source: TradingEconomics
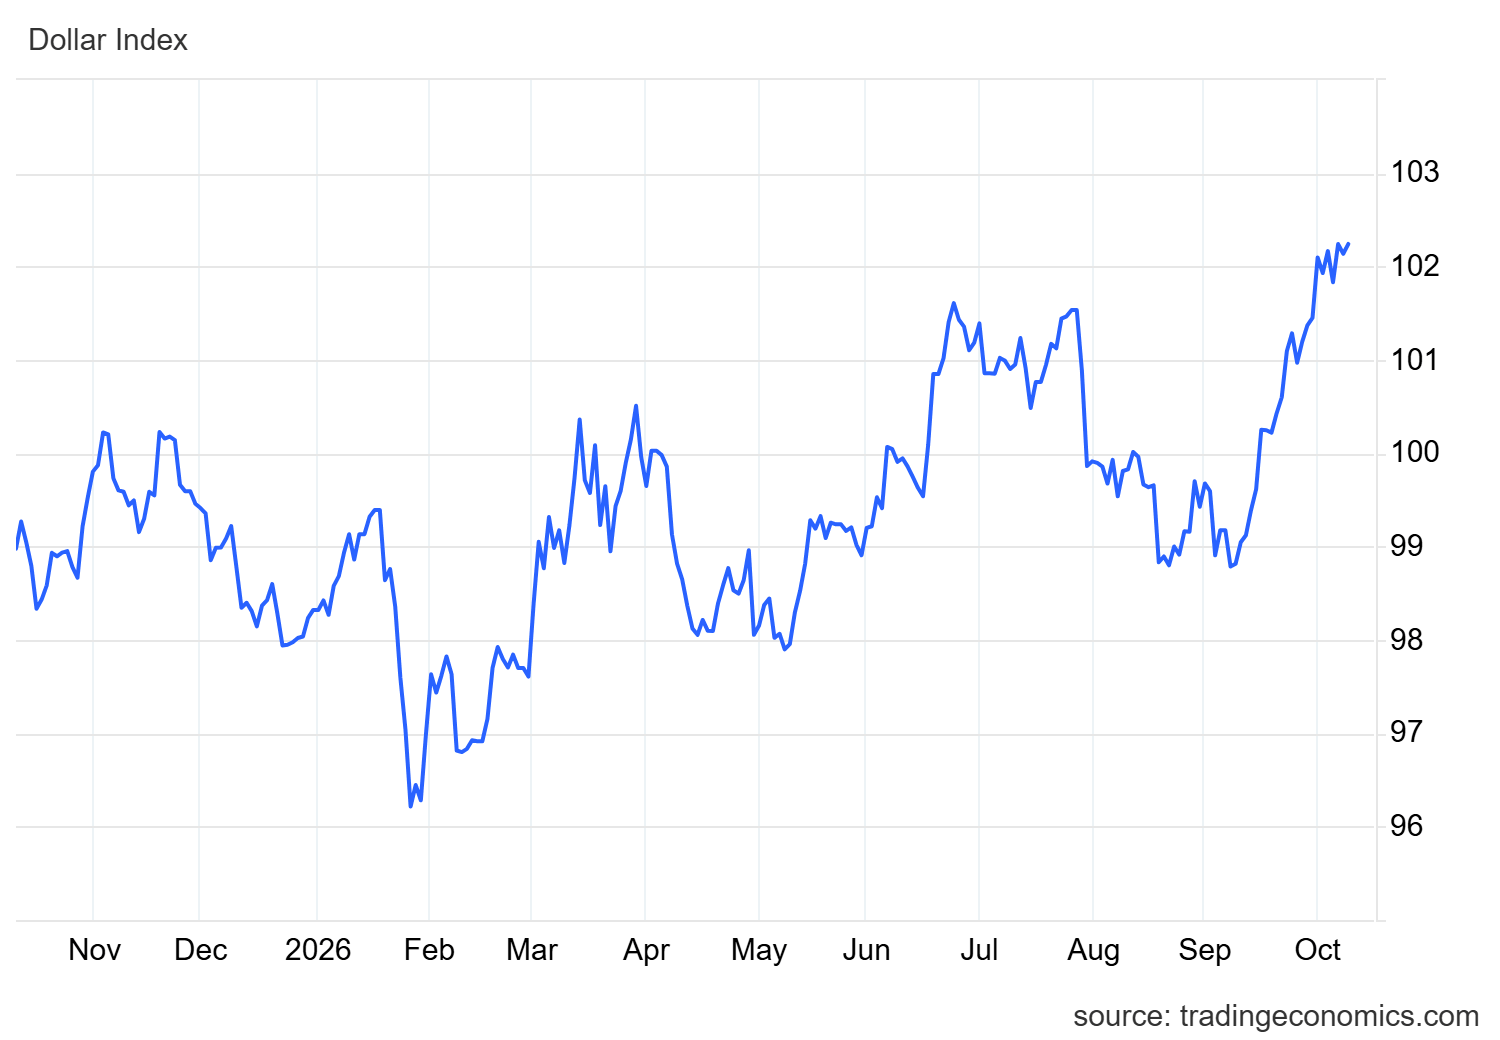
The impact of this dynamic can also be seen in the behavior of the DXY, the index that measures the U.S. dollar against its major counterparts. By the end of the week, the index continues to trade above the 102-point area, reflecting that demand for the dollar remains relatively stable in an environment where U.S. bond yields continue to stay elevated.
Source: TradingEconomics
Taking all of this into account, it appears that the decline in Japanese yields, combined with the resilience of U.S. Treasury yields, continues to widen the relative attractiveness of dollar-denominated investments. As long as expectations of a more aggressive Federal Reserve remain relevant, it may be difficult for the yen to regain strength in a consistent manner. As a result, the current phase of indecision around USD/JPY could continue to remain relevant in the sessions ahead.
USD/JPY Technical Forecast
Source: StoneX, Tradingview
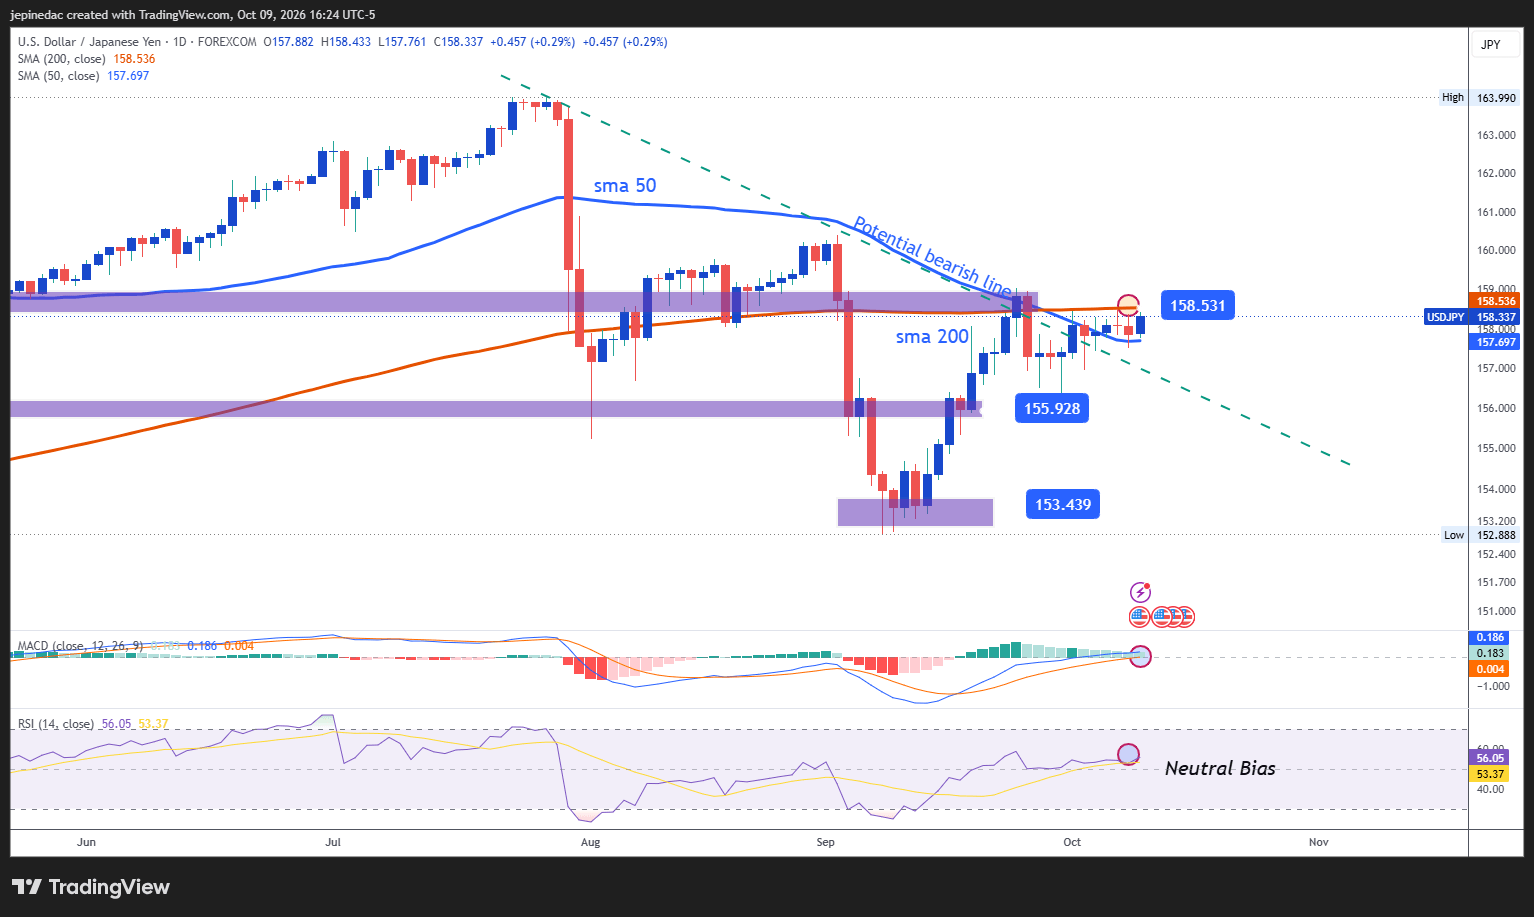
- Neutrality is becoming increasingly relevant: For several months, USD/JPY respected a long-term bearish trendline that remained the chart's most important technical structure. However, the recovery observed over recent weeks has begun to challenge this reference and has favored a much more neutral trading environment. If this lack of direction continues to dominate price action, the bearish structure could gradually lose relevance and give way to a broader trading range in the short term.
- MACD: The MACD histogram continues to trade very close to the 0 neutral line, reflecting an increasingly balanced dynamic in short-term moving-average momentum. This reading also supports the idea that a lack of direction could remain an important feature of market behavior in the coming sessions.
- RSI: A similar picture can be observed in the RSI, whose line continues to fluctuate near the 50 level, representing the indicator's neutral zone. This reading reflects a relatively stable balance between buyers and sellers and supports the possibility that a phase of indecision could continue to dominate the market in the near term.
Key Levels:
- 158.50 – Key Resistance: This level aligns with important retracement zones observed in previous weeks, the 50-period and 200-period simple moving averages, and the long-term bearish trendline. Price action that manages to consolidate above this area could bring an end to the bearish structure that has dominated recent months and open the door to a more relevant bullish bias on the daily chart.
- 155.92 – Near-Term Barrier: An important retracement area that continues to act as the market's primary equilibrium zone. If price moves back toward this level and continues to lack direction, a more established range-bound environment could begin to develop and gain relevance as the dominant technical structure in the sessions ahead.
- 153.43 – Main Support: An area of important lows that remains one of the most relevant downside barriers observed in recent months. A move back toward this level could restore momentum to the bearish bias and reinforce the importance of the long-term downtrend as the dominant technical structure over the coming weeks.
Written by Julian Pineda, CFA, CMT – Market Analyst
Follow him on: @julianpineda25