
USD/JPY, EUR/JPY, GBP/JPY Talking Points:
- USD/JPY has held up relatively well as the USD has dropped down to fresh three-year lows, with a higher-low sequencing still in-play as taken from a trendline drawn from April and early-June swing lows.
- EUR/JPY and GBP/JPY have been cleaner setups for Yen-weakness, however, with pullbacks to key support levels looked at in Monday’s video leading to bouts of bullish continuation.
- I look at USD/JPY, EUR/JPY and GBP/JPY in each weekly webinar, and you’re welcome to join the next. Click here to register.
It’s a red bar so far this week for USD/JPY but given broader context the USD doesn’t seem as bearish as it does elsewhere, such as EUR/USD, GBP/USD or USD/CAD. In USD/JPY, the pair continues to hold a trendline that’s been in-play from April and early-June lows. That’s not to say that this week has been a positive for bulls because it hasn’t, as lower-lows and lower-highs have driven after the stunning reversal from 148.00 on Monday.
But the fact that USD/JPY hasn’t folded down to fresh lows even as the USD has elsewhere speaks to the Yen-weakness theme that’s remained clear, particularly in venues like EUR/JPY and GBP/JPY.
USD/JPY Daily Chart
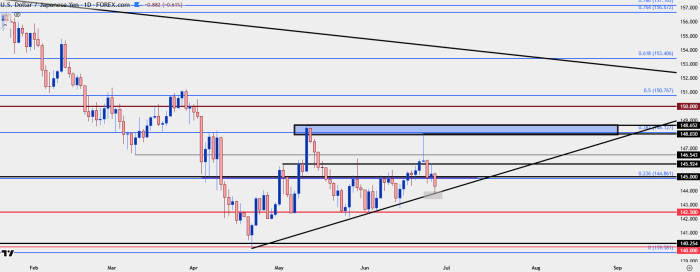
Chart prepared by James Stanley; data derived from Tradingview
USD/JPY Four-Hour
From the four-hour chart we can see the lower-lows and highs that have come into play this week, and there’s been some clean run with prior structure. The 145.00 level ended up coming into play to help set support briefly on Tuesday morning, leading to a bounce up to 145.92. But that’s when sellers returned with a vengeance, and that next test of 145.00 couldn’t hold the selling, leading to the push down to a fresh lower-low and a test of the longer-term support trendline.
At this point, the 145.00 level is now lower-high resistance potential and for bulls to get back in-control, they’d likely want to see a push back-above the 145.92 price to get enough confidence that the tide could turn.
For deeper support, it’s the 142.50 level that lurks below current price that remains of interest, as that set the lows in late-May and early-June.

USD/JPY Four-Hour Chart
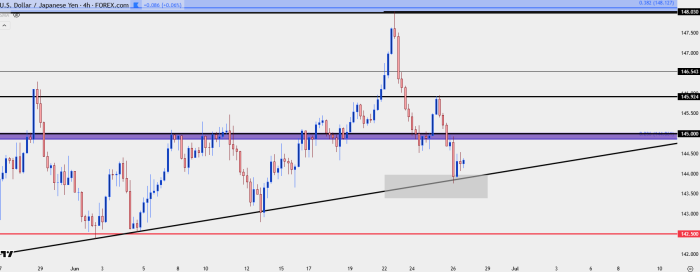
Chart prepared by James Stanley; data derived from Tradingview
GBP/JPY
As I said in the Monday video, Yen-weakness appeared more attractive elsewhere and GBP/JPY was one of those venues. At the time, we had a resistance hit at the 198.08 level, which has some historical reference from back in 2008. The pullback from that built in higher-lows, leading to a break of that price and, eventually, a grind of resistance at 198.50. As I said in today’s video given the consistent response at that resistance, I wouldn’t want to assume a break just yet. But, given the bounce earlier this morning, there remains shorter-term bullish context with possible higher-low sequencing.
The 198.08 level is prime for short-term themes, and below that, we have the 197.71-197.82 zone that remains in-play. Buyers need to hold price above that to keep the door open for bullish momentum and breakout potential at the 198.50 level that has so far proven resistant.
GBP/JPY Two-Hour Price Chart
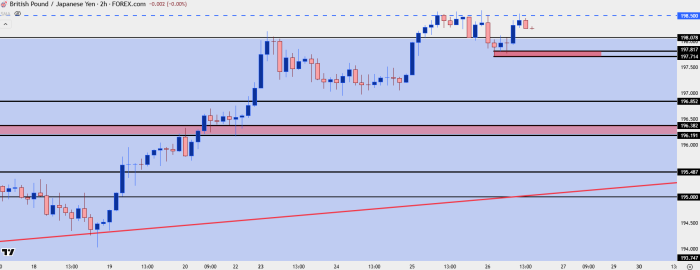
Chart prepared by James Stanley; data derived from Tradingview
EUR/JPY
EUR/JPY has been flying for the past four weeks and the pair started this week with a strong run at a major psychological level of 170.00. So far – that level remains un-tested.
EUR/JPY Weekly Chart
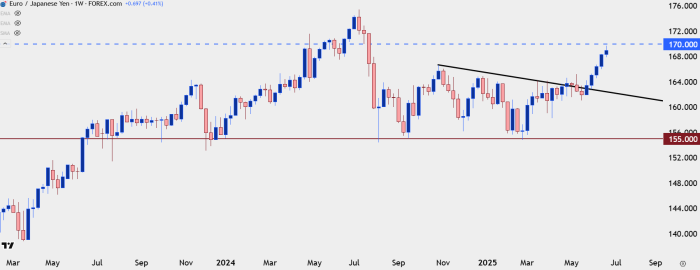
Chart prepared by James Stanley; data derived from Tradingview
EUR/JPY Shorter-Term
As I said in the Monday video given the history of EUR/JPY and the 170.00 handle I didn’t want to push the trend too aggressively near that major psychological level. But, I also thought that pullbacks remained opportunistic, and the level looked at on Monday is the 168.03 level, which is what ultimately helped to set the low the morning after. That bounce has so far shied away from a re-test of the highs, but there’s also been a higher-low that’s posted above 168.03, keeping the door open for bullish continuation and perhaps even a test of the 169.76 Fibonacci level or perhaps even the 170.00 level that bulls haven’t seemed to want to encounter just yet.
EUR/JPY Four-Hour Chart
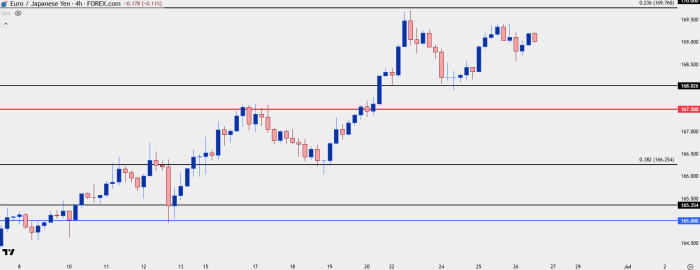
Chart prepared by James Stanley; data derived from Tradingview
EUR/JPY Two-Hour
The two-hour chart shows some additional interest as the higher-low so far today has held around the 168.74 prior swing. I’m tracking short-term resistance at 169.27 after which the Monday high of 169.71 comes into the picture, followed by 170.00.
EUR/JPY Two-Hour Price Chart
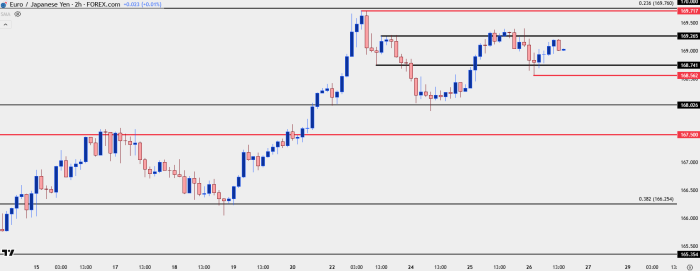
Chart prepared by James Stanley; data derived from Tradingview
--- written by James Stanley, Senior Strategist