
Over the past three trading sessions, the USD/CAD has begun to show a renewed bearish bias, reflecting a rebound in the strength of the Canadian dollar. In the short term, the pair has recorded a decline of around -0.77%, accompanied by steady selling pressure, partly driven by expectations of interest rate cuts from the Federal Reserve, which has contributed to the recent weakness of the U.S. dollar. If this factor remains relevant, downward pressure is likely to persist in USD/CAD price movements over the coming sessions.

Lower Rates Ahead?
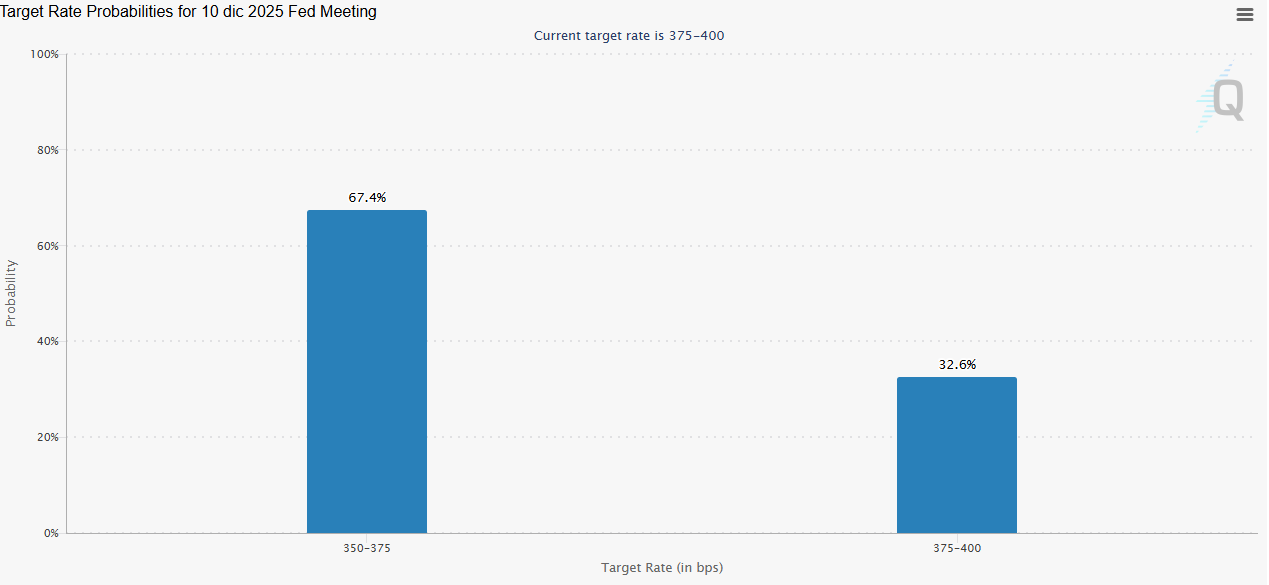
In recent days, the Federal Reserve’s monetary policy outlook has begun to shift, as the CME Group FedWatch Tool now shows a 67.4% probability that the U.S. central bank will announce a rate cut, lowering its benchmark from the current 4.00% to 3.75% at the December 10 meeting. This expectation reinforces the view of a more accommodative Fed heading into the end of 2025, signaling a trend toward lower interest rates.
Source: CMEGROUP
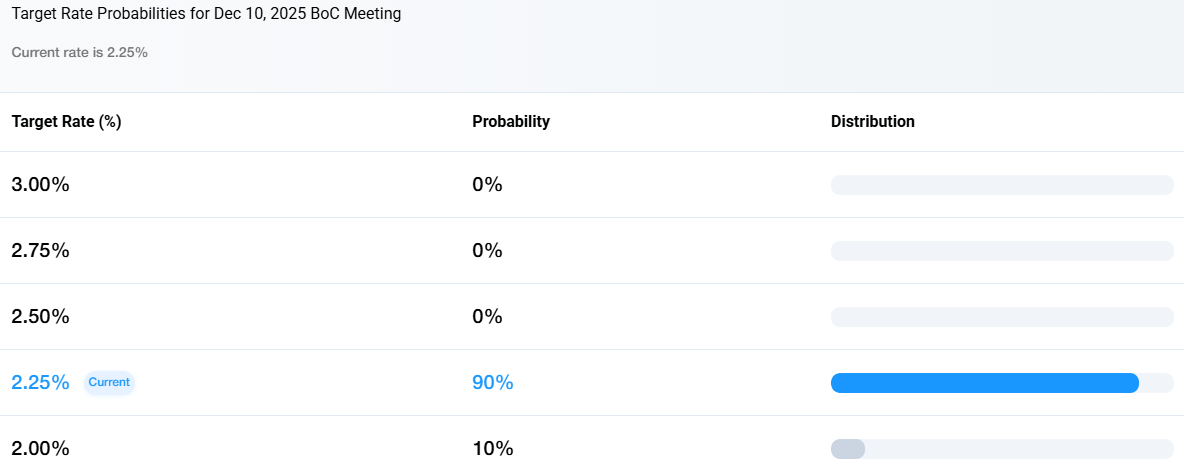
In contrast, the Bank of Canada (BoC) appears to be maintaining a more stable outlook. The probabilities indicate that the central bank will keep its policy rate at 2.25% during its December 10 meeting, with an estimated 90% likelihood of no changes. Unlike the Fed, the BoC seems to be adopting a neutral short-term stance, which could narrow the interest rate differential between the two central banks. This adjustment could, in turn, increase the short-term appeal of Canadian dollar-denominated assets.
Source: Bankofcanadaodds
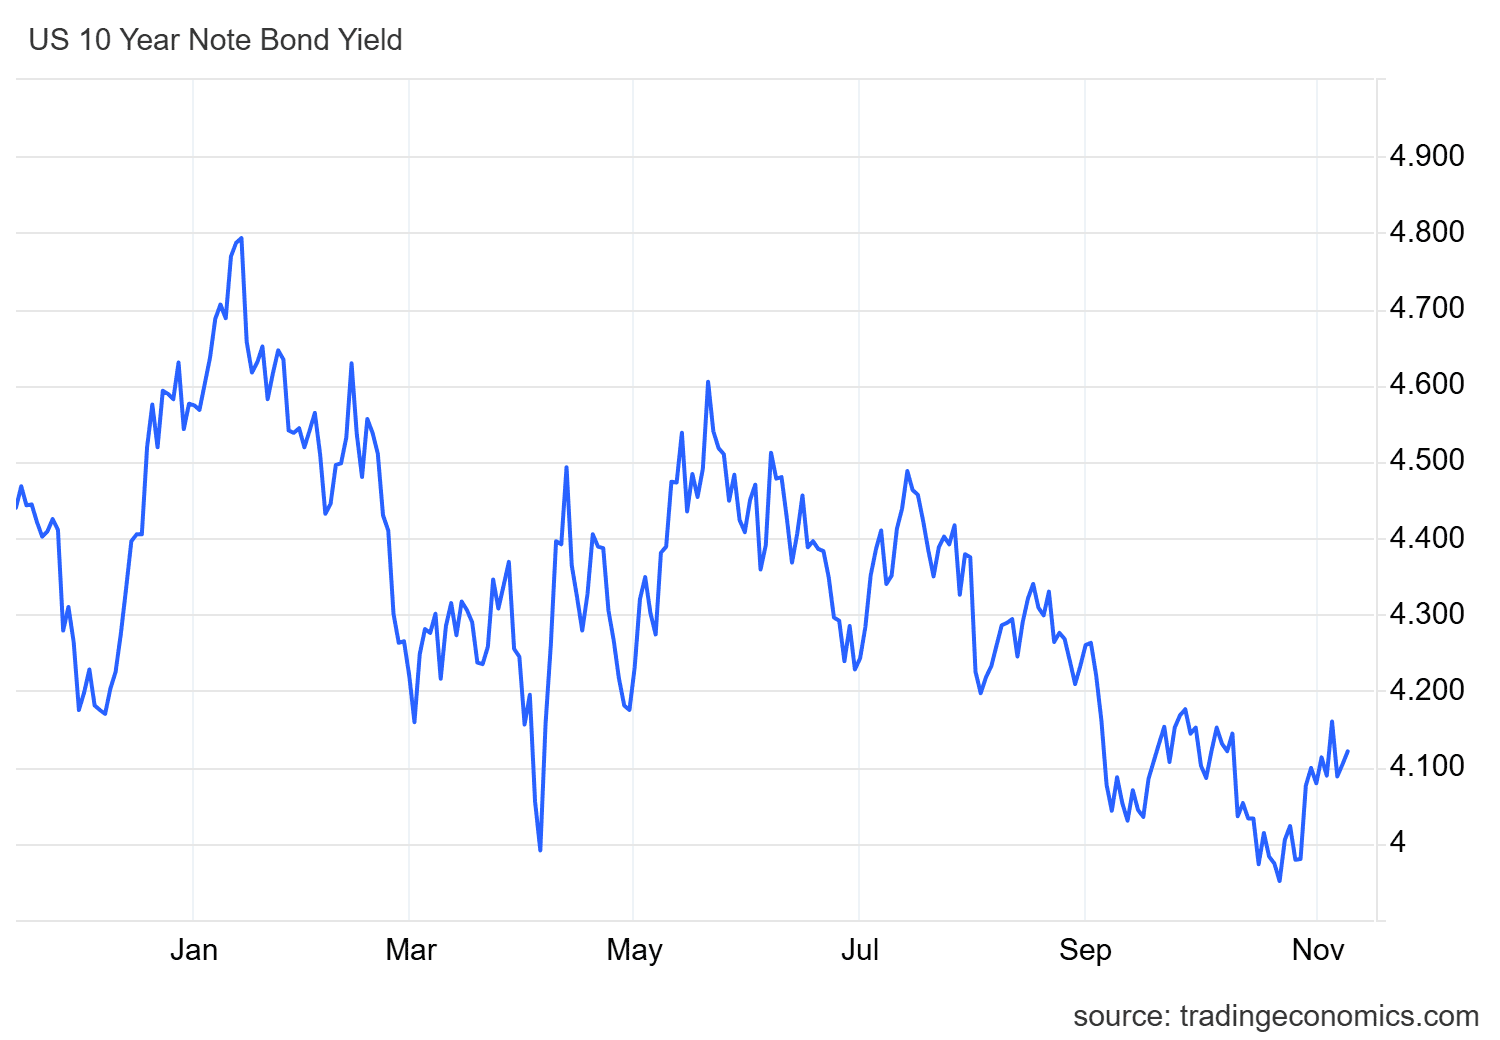
Additionally, the softer tone adopted recently by the Federal Reserve has led to a decline in U.S. 10-year Treasury yields, which have fallen from 4.15% to 4.12%. This reduction lowers the attractiveness of U.S. bonds, which in turn may be dampening foreign demand for U.S. dollars while supporting the Canadian dollar in the short term.
Source: TradingEconomics
As a result, the recent policy shifts in the United States may be narrowing the divergence between the Fed and the BoC. Combined with lower bond yields, this environment could sustain a weaker U.S. dollar, reinforcing consistent selling pressure on USD/CAD. If this trend continues, the pair could experience continued bearish corrections in the coming sessions.
USD/CAD Technical Outlook

Source: StoneX, Tradingview
- Uptrend Still Intact: Despite the current short-term pullback in USD/CAD, the chart shows that the upward trendline established since late July remains intact. Recent declines have not been deep enough to threaten this structure. Moreover, a notable technical crossover has emerged, with the 50-period moving average crossing above the 200-period moving average, confirming that the long-term structural momentum remains bullish. Therefore, a deeper correction would likely be needed before the dominant bullish bias loses relevance. For now, the uptrend line continues to serve as the primary technical structure on the daily chart.
- RSI: The RSI indicator shows a steady downward slope, gradually approaching the neutral 50 level. This reflects a balance between buying and selling pressure, suggesting that the pair could enter a period of indecision over the next few sessions, with no clear short-term direction as long as this technical neutrality persists.
- MACD: The MACD shows a similar pattern, with its histogram fluctuating around the zero line, indicating a lack of directional strength. This setup suggests a neutral and range-bound scenario, typical of a consolidation phase in price action.
Key Levels to Watch:
- 1.41144 – Key Resistance: Corresponds to the recent highs and represents the most important bullish barrier to watch. A breakout above this level could reactivate a buying bias and strengthen the upward trendline that still dominates the chart.
- 1.40326 – Current Barrier: A zone of indecision corresponding to the 38.2% Fibonacci retracement level on the chart. While price remains near this area, a short-term sideways range could continue to develop.
- 1.39441 – Critical Support: This level coincides with the convergence of the 50- and 200-period moving averages. A break below this point would put the bullish structure at risk and could lead to a dominant bearish bias in the short to medium term.
Written by Julian Pineda, CFA, CMT – Market Analyst
Follow him on: @julianpineda25