
During today’s session, USD/MXN has started the year with a consistent selling move, posting a decline of more than 0.3% in favor of the Mexican peso and against the U.S. dollar. This selling pressure has pushed the pair back toward 2025 lows, driven mainly by expectations surrounding central bank monetary policy. While the Bank of Mexico is expected to maintain a more cautious stance, the Federal Reserve continues to signal the possibility of additional rate cuts, a scenario that could further reinforce structural weakness in the U.S. dollar. Within this context, the Mexican peso has begun to regain ground, and as long as these dynamics remain in place, selling pressure is likely to continue dominating USD/MXN price action in the coming trading sessions.

What to Expect Next from Central Banks?
One of the most relevant drivers behind current USD/MXN movements is the divergence in monetary policy outlooks between the United States and Mexico. In the case of the Bank of Mexico, the most recent December meeting made it clear that there is no urgency to implement aggressive rate cuts in the short term. Inflation remains a key priority, particularly given that the central bank’s target stands at an optimal level of 3%.
In recent months, inflation in Mexico has shown a gradual uptick, rising from 3.57% in October to 3.8% in November. This move has begun to push inflation further away from the central bank’s target, reinforcing a neutral interest rate stance heading into the first part of 2026. With one of the highest policy rates among major central banks, currently at 7%, the Mexican peso continues to attract short-term investment flows, supporting sustained demand for the local currency.

Source: TradingEconomics
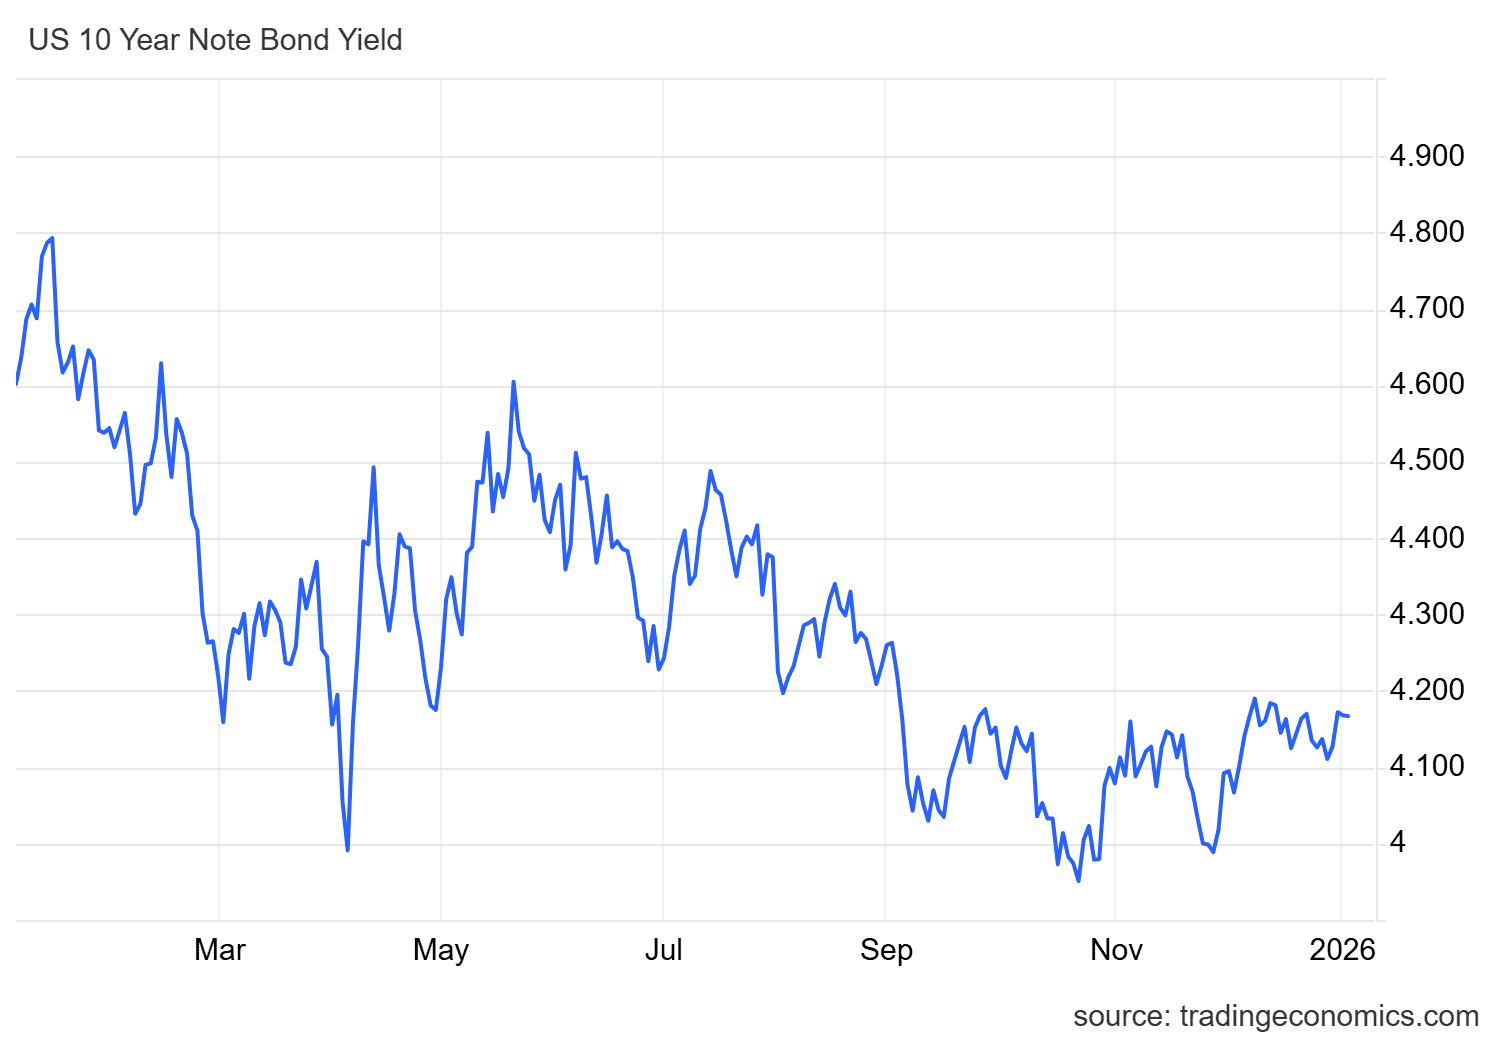
In contrast, the U.S. Federal Reserve continues to display a more uncertain stance. According to CME Group probabilities, there is an 85.1% chance that rates will remain unchanged at 3.75% at the January 28 meeting. However, for the March 18 meeting, a 42.5% probability has emerged for a rate cut toward 3.5%. This lack of clarity has limited a sustained recovery in U.S. Treasury yields, particularly in the 10-year segment, which has attempted to consolidate above 4.1% without success, instead showing a neutral trend in recent sessions.
Source: TradingEconomics
This backdrop is important, as the U.S. bond market typically attracts foreign capital that supports dollar demand. As long as Federal Reserve indecision continues to restrain yield recovery, demand for U.S. dollars may remain contained, allowing the Mexican peso to continue gaining ground.
As a result, the combination of stable and elevated interest rates in Mexico alongside a hesitant Federal Reserve reinforces the relative attractiveness of the Mexican peso. With a 7% policy rate compared to 3.75% in the United States, the interest rate differential continues to favor peso-denominated investments, reducing the appeal of the dollar. While this fundamental catalyst remains in place, selling pressure is likely to continue dominating USD/MXN movements in the short term.
USD/MXN Technical Outlook

Source: StoneX, Tradingview
- Nothing Stops the Broad Bearish Channel: In the first trading sessions of 2026, USD/MXN continues to respect the broad bearish channel that dominated much of 2025. So far, no meaningful bullish corrections have emerged to threaten this structure, leaving the selling channel as the most important technical formation to monitor. As long as selling pressure holds, this channel is likely to continue guiding short-term price movements.
- RSI: The RSI has resumed a negative slope, remaining below the neutral 50 level, indicating that selling momentum continues to dominate the average of the past 14 sessions. As long as the indicator maintains downward oscillations, selling pressure is likely to remain the prevailing force in the short term.
- MACD: The MACD histogram maintains a bearish bias and is approaching a potential cross below the neutral zero line. If confirmed, this move would reinforce signals of selling dominance in short-term moving averages, supporting additional downside pressure in price action.
Key Levels:
- 18.50 – Key resistance: An area located above the 50-period simple moving average. A sustained move above this level could put the bearish channel at risk and open the door to a medium-term bullish bias.
- 18.24 – Nearby barrier: A level where the 50-period moving average converges with the bearish trendline, making it a key reference in the event of short-term bullish corrections.
- 17.89 – Key support: A level marking the 2025 lows and prices not seen since 2024. If selling pressure consolidates below this area, the bearish channel could extend into the coming weeks.
Written by Julian Pineda, CFA, CMT – Market Analyst
Follow him on: @julianpineda25