





Chinese Yuan Technical Analysis: USD/CNH Trump Rally Rolls into US CPI
USD/CNH has mirrored DXY trends quite well of late, and the Trump-fueled rally faces its next major test with US CPI data set for release tomorrow.
Share this:

Chinese Yuan, USD/CNH Talking Points:
- USD/CNH has mirrored the Q4 rally in the US Dollar quite well, with a strong move developing over the past week on the back of Trump’s Presidential win.
- This week USD/CNH has been working on a 200-dma break and is fast nearing some points of resistance that bulls have had trouble leaving behind over the past couple years.
It was just over a month ago that USD/CNH looked like it could quickly break down. As the DXY move was stalling in late-September, the addition of Yuan strength led to a forceful move down to fresh yearly lows in the pair, testing below the widely-followed 7.0000 handle for the first time since May of 2023. But, as the tide started to shift for DXY at the Q4 open, so did the trend in USD/CNH.
Even coming into last week bears held some favor. Price remained below the 200-day moving average and the pullback on Monday and Tuesday in DXY made it look as though USD/CNH could push lower, with support showing at prior resistance, around the 7.1000 level.
But as the Wednesday rally took over in DXY, USD/CNH quickly jumped and re-tested the 200-day. And so far this week, that’s been the object of attraction from the daily chart as buyers have continued to chew through that resistance while showing greater control of near-term momentum.
USD/CNH Daily Chart
 Chart prepared by James Stanley, USD/CNH on Tradingview
USD/CNH Momentum v/s Swings
The big driver for the USD is tomorrow’s CPI report and expectations are relatively high, with headline CPI expected at 2.6% against last month’s 2.4% reading and core CPI at 3.3% which would match last month’s print.
If the data comes out below expectations and a pullback shows in DXY trends, there could be an excellent opportunity to gauge just how aggressive bulls remain to be, and in USD/CNH, there’s now bullish near-term structure that could offer a telling look at upcoming trends and themes.
In USD/CNH, the big spot that would need to remain defended to keep that momentum tilted in bulls’ favor is the 7.2000 level, which is now confluent with the 200-day moving average. It’s the 7.2500 level that’s held resistance thus far and that makes sense as it could be an attractive spot for longs to have taken exposure off the table after a strong one-sided run. If sellers can dig below that level, however, particularly on a daily close basis, then it’ll start looking like a failure from bulls to hold the break of the 200-day moving average, and the weekly bar would show an extended upper wick indicating failure from buyers.
USD/CNH Four-Hour Chart
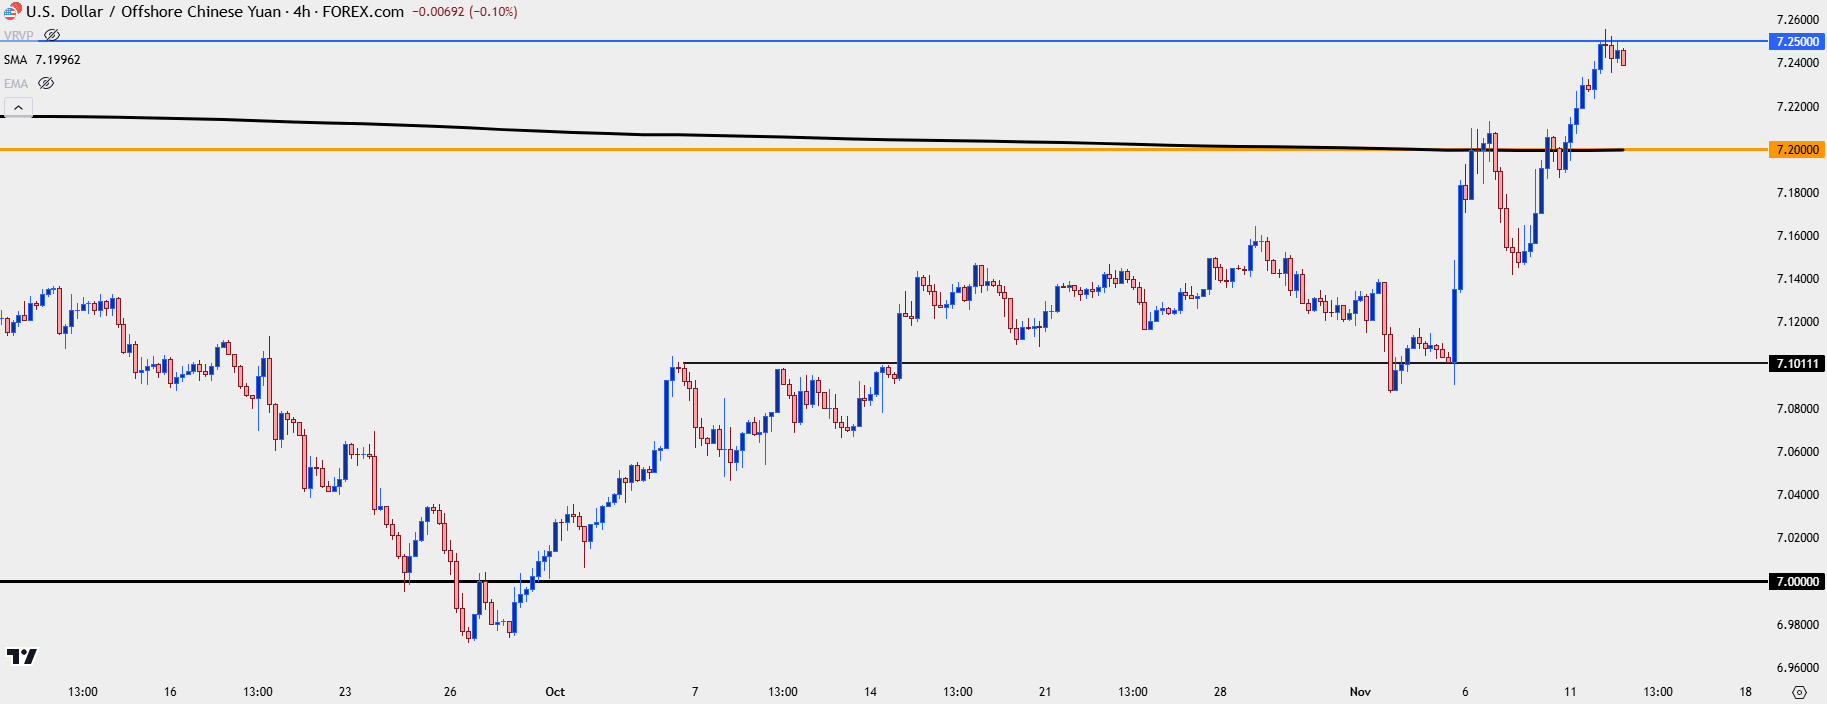 Chart prepared by James Stanley, USD/CNH on Tradingview
--- written by James Stanley, Senior Strategist
Chinese Yuan, USD/CNH Talking Points:
- USD/CNH has mirrored the Q4 rally in the US Dollar quite well, with a strong move developing over the past week on the back of Trump’s Presidential win.
- This week USD/CNH has been working on a 200-dma break and is fast nearing some points of resistance that bulls have had trouble leaving behind over the past couple years.
It was just over a month ago that USD/CNH looked like it could quickly break down. As the DXY move was stalling in late-September, the addition of Yuan strength led to a forceful move down to fresh yearly lows in the pair, testing below the widely-followed 7.0000 handle for the first time since May of 2023. But, as the tide started to shift for DXY at the Q4 open, so did the trend in USD/CNH.
Even coming into last week bears held some favor. Price remained below the 200-day moving average and the pullback on Monday and Tuesday in DXY made it look as though USD/CNH could push lower, with support showing at prior resistance, around the 7.1000 level.
But as the Wednesday rally took over in DXY, USD/CNH quickly jumped and re-tested the 200-day. And so far this week, that’s been the object of attraction from the daily chart as buyers have continued to chew through that resistance while showing greater control of near-term momentum.
USD/CNH Daily Chart
USD/CNH Momentum v/s Swings
The big driver for the USD is tomorrow’s CPI report and expectations are relatively high, with headline CPI expected at 2.6% against last month’s 2.4% reading and core CPI at 3.3% which would match last month’s print.
If the data comes out below expectations and a pullback shows in DXY trends, there could be an excellent opportunity to gauge just how aggressive bulls remain to be, and in USD/CNH, there’s now bullish near-term structure that could offer a telling look at upcoming trends and themes.
In USD/CNH, the big spot that would need to remain defended to keep that momentum tilted in bulls’ favor is the 7.2000 level, which is now confluent with the 200-day moving average. It’s the 7.2500 level that’s held resistance thus far and that makes sense as it could be an attractive spot for longs to have taken exposure off the table after a strong one-sided run. If sellers can dig below that level, however, particularly on a daily close basis, then it’ll start looking like a failure from bulls to hold the break of the 200-day moving average, and the weekly bar would show an extended upper wick indicating failure from buyers.
USD/CNH Four-Hour Chart
--- written by James Stanley, Senior Strategist
Related tags:


The complete CFD trading experience
Award-winning platforms, competitive spreads, low commissions and dedicated support.
We live and breathe the markets and are dedicated to helping traders realise their ambitions as we continue to set the industry bar.
Economic calendar
Web Trader platform
Our sophisticated web-based platform is packed with features.
Related articles
ASX 200 Outlook: A Rates Trade Disguised as a Stock Market?
Australian bond futures have exhibited a far stronger relationship with the ASX 200 than Wall Street over recent months. Now both markets are displaying remarkably similar price structures.

AUD/USD Bulls Fight Back After Australian Jobs Shock
AUD/USD has been hit by another ugly Australian employment report, sending RBA rate hike expectations sharply lower. Yet the relationships driving the currency have shifted since quarter-end, and improving risk appetite could provide the fuel for a recovery.

S&P 500 Another Thursday Bounce After CPI-Fueled Sell-Off
Carnage may be overstating it a bit given that fresh ATHs were printed just a week ago but if you were reading the headlines, it would certainly seem to be more than just a -2.28% pullback from the high.
StoneX Europe Ltd may make third party material available on this website which may contain information included but not limited to the conditions of financial markets. The material is for information purposes only and does not contain, and should not be construed as containing, investment advice and/or investment recommendation and/or an investment research and/or an offer of or solicitation for any transactions in financial instruments; any decision to enter into a specific transaction shall be made by the client following an assessment by him/her of their situation.
StoneX Europe Ltd makes no representation or warranty and assumes no liability as to the accuracy or completeness of the information provided, nor any loss arising from any investment based on a recommendation, forecast or other information supplied. You should always seek independent advice as to your suitability to speculate in any related markets and your ability to assume the associated risks, if you are at all unsure. We are not under any obligation to update any such material. Any opinion made may be personal to the author and may not reflect the opinion of StoneX Europe Ltd.