



Crude Oil, Gold Price Outlook: Short-Term Selling Pressure, Long-Term Dip Buying Opportunities?
Crude Oil, Gold Price Outlook: Commodity prices remain under pressure, shifting focus toward short-term selling risks and potential long-term dip-buying opportunities as progress toward resolving the Middle East conflict stalls. Explore key support and resistance levels, bearish and bullish scenarios, and long-term dip-buying opportunities in commodities.
Share this:

Commodity prices remain under pressure, shifting focus toward short-term selling risks and potential long-term dip-buying opportunities as progress toward resolving the Middle East conflict stalls.
Crude Oil Price Outlook: Weekly Time Frame – Log Scale

Source: Trading view
Why $85 Remains the Key Level
The dominant outlook for crude oil remains the risk of a confirmed bearish breakout below its multi-month consolidation pattern that has been developing since March 2026. The critical level to monitor is the $85 support zone, which aligns with the 50% Fibonacci extension of the June 2022–December 2025–March 2026 price cycle.
Bullish Momentum Has Not Completely Faded
Despite recent weakness, bullish risks remain present. Weekly RSI and momentum indicators continue to hold above the neutral 50 level, suggesting that the latest decline may evolve into a false triangle breakdown rather than a confirmed bearish continuation.
Bearish Scenario: Breakdown Below $85
A sustained hold below $85 would confirm a bearish bias and expose crude oil prices to the $77–$74 zone, corresponding to the June 2025 highs recorded during last year's Middle East conflict.
Beyond that, the market could extend losses toward the multi-year support and resistance zone near $67, potentially easing energy-market pressures on global economies.
Bullish Scenario: Recovery Above $94–$96
If crude oil successfully regains the consolidation midpoint near $94–$96, bullish momentum could strengthen considerably.
A move back toward $100 would become increasingly likely, with additional upside targets at $105, $111, and $120 based on Fibonacci extension levels derived from the April–May price cycle.
Long-Term Upside Targets
A sustained breakout above $120 would expose the longer-term resistance zones near $135 and $157, based on Fibonacci extensions measured from the broader 2020–2022–2025 cycle.
To follow this analysis live, I discuss these scenarios during my daily MENA Market Call webinars.
Register for the next webinar here:
https://attendee.gotowebinar.com/register/1712903232130037596
Gold Price Outlook: Daily Time Frame – Log Scale
Source: Trading view
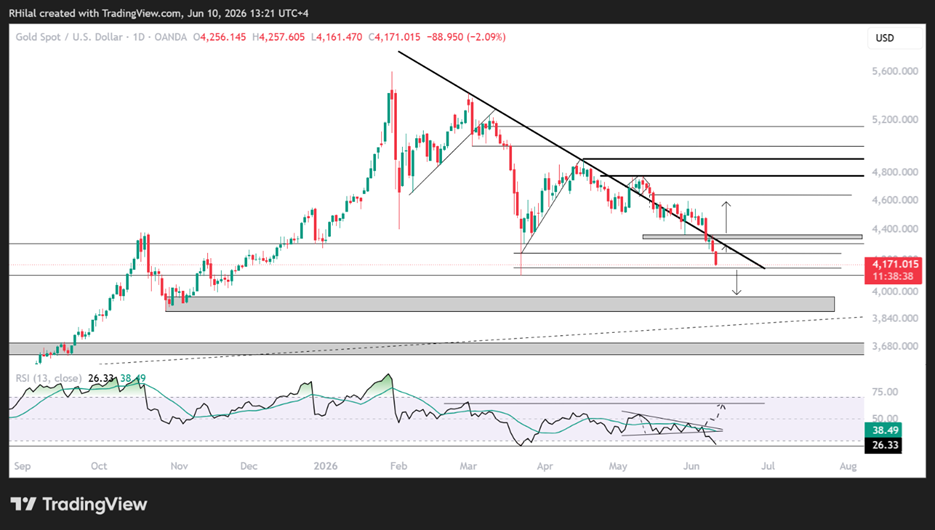
Gold's bearish bias remains visible on the daily chart as price action continues to struggle below the descending trendline connecting the lower highs formed since March 2026. This keeps the bearish outlook intact and aligns with the daily RSI's breakdown below its multi-month triangle pattern, and oversold momentum with yearly lows.
From a price action perspective, resistance remains concentrated below 4,360, while 4,140 serves as the key support level.
Bearish Scenario
A breakdown below 4,140 would increase the risk of a deeper decline toward 4,080. These levels will be important in determining whether gold can establish another bullish rebound or extend losses toward the 3,870 region, where longer-term dip-buying opportunities may emerge once again, near October 2025 lows.
Bullish Scenario
A sustained breakout above the multi-month trendline resistance and the 4,360 level would expose gold to the next resistance zones at 4,400, 4,460, and 4,730.
A successful move through these levels would shift attention toward 4,900 and 5000, where bullish momentum would face another major sustainability test. A sustained breakout above these areas would significantly improve bullish confidence and reopen the path toward record high projections.
Gold Price Outlook: 6-Month Time Frame – Log Scale
Source: Trading view
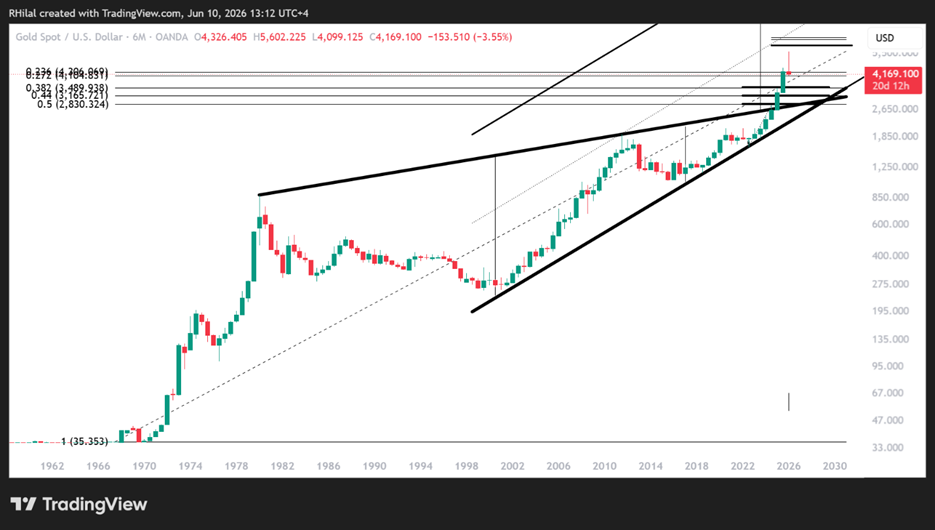
When viewed from a longer-term perspective, gold's price action and projections continue to align with historically significant technical levels.
Testing the 0.236 Fibonacci Retracement
Analyzing gold's movement between 1960 and 2026 shows that prices are currently testing the 0.236 Fibonacci retracement level. At the same time, the latest candle structure resembles a shooting star pattern, highlighting the market's inability to sustain gains above the 4,360 resistance level discussed in the daily time frame analysis.
Why the 4,100 Level Matters
This reinforces the bearish case if prices remain below the psychological 4,100 mark. A sustained hold beneath this level could expose gold to a decline toward the 0.382 Fibonacci retracement near 3,500, which also corresponds with the multi-month resistance zone from 2025.
This area may serve as another important consolidation zone or potential turning point for a bullish rebound.
Extreme Bearish Scenario: Could Gold Reach 2,830?
Under a more extreme bearish scenario, downside pressure could extend toward the upper boundary of the multi-decade consolidation range, near the 50% Fibonacci retracement at 2,830.
Historically, this level has acted as a major turning point for the yellow metal and would likely attract significant market attention should prices approach it.
Long-Term Dip Buying Opportunities Remain Favored
Despite short-term downside risks, dip-buying opportunities continue to be favored from a long-term perspective. Gold's historical trend remains positive, supporting a framework focused on identifying key retracement zones for potential bullish continuation opportunities.
Given gold's elevated volatility and steep price advances over recent years, a level-by-level approach remains appropriate while assessing the next phase of the longer-term uptrend.
Written by Razan Hilal, CMT
Follow on X: @Rh_waves


The complete CFD trading experience
Award-winning platforms, competitive spreads, low commissions and dedicated support.
We live and breathe the markets and are dedicated to helping traders realise their ambitions as we continue to set the industry bar.
Economic calendar
Web Trader platform
Our sophisticated web-based platform is packed with features.
Related articles
Gold Breaks Down on Descending Triangle, Sets Up $4k Test
Gold started last week with a strong sell-off but from that move a bounce developed. Bulls could not hold on through the weekly close, however, and the bearish structure remains in-place for XAU/USD.

USD/JPY weekly outlook: Quarter turn scrambles rates regime
USD/JPY’s tight relationship with front-end US rates broke down sharply last week, but quarter-turn flows and positioning suggest the disconnect may prove temporary.


Gold Update: XAU/USD Remains Under Pressure Even After the NFP Report
As the trading week comes to an end, weakness around gold price action remains evident in the short term. This can be seen in the performance of the past two sessions, where the metal has declined by approximately 0.3%. Although the move has not been particularly aggressive, it highlights that buying pressure continues to struggle to regain control of the market.

StoneX Europe Ltd may make third party material available on this website which may contain information included but not limited to the conditions of financial markets. The material is for information purposes only and does not contain, and should not be construed as containing, investment advice and/or investment recommendation and/or an investment research and/or an offer of or solicitation for any transactions in financial instruments; any decision to enter into a specific transaction shall be made by the client following an assessment by him/her of their situation.
StoneX Europe Ltd makes no representation or warranty and assumes no liability as to the accuracy or completeness of the information provided, nor any loss arising from any investment based on a recommendation, forecast or other information supplied. You should always seek independent advice as to your suitability to speculate in any related markets and your ability to assume the associated risks, if you are at all unsure. We are not under any obligation to update any such material. Any opinion made may be personal to the author and may not reflect the opinion of StoneX Europe Ltd.