



EUR/JPY pushes lower as recession fears set in
In addition to EUR/USD moving lower, EUR/JPY could continue lower as well, as the Yen is also considered a safe haven currency.
Share this:

The headlines regarding worries of a recession have been coming in fast and furious. The worse than expected PMI headlines 2 weeks ago out of Europe and the US were finalized this week. The European S&P Global Manufacturing PMI Final for June was 52.1 vs 54.6 in May. This was the lowest level since August 2020. The ISM Manufacturing PMI for June was 53 vs 56.1 in May. This was the lowest level since June 2020. Although the US manufacturing data was just as bad as in Europe, traders have been flocking to the US Dollar as a safe haven currency. As a result, EUR/USD has fallen below 102 and appears that it could be on its way to parity.
However, the US Dollar isn’t the only currency that traders are moving to for safety. The Yen is also considered a safe haven. As a result of a weak Euro and a strong Yen, EUR/JPY has been taking a hit over the last few days. Since February 2020, EUR/JPY had been moving higher in an upward sloping channel. The pair made its 2022 low on March 7th at 123.39 and moved higher until June 28th, creating a triple top near 144.27. This is EUR/JPY’s highest level since January 2015. On June 28th, the EUR/JPY began moving lower, and just 1 week later on July 5th, the pair broken below the bottom trendline of the longer-term, upward sloping channel near 139.50. Today, EUR/JPY continues lower and has broken the neckline of the triple top near 137.70. The target for the break of the neckline of a triple top is the height from the top to the neckline, added to the breakdown level. In this case the target is near 131.10.
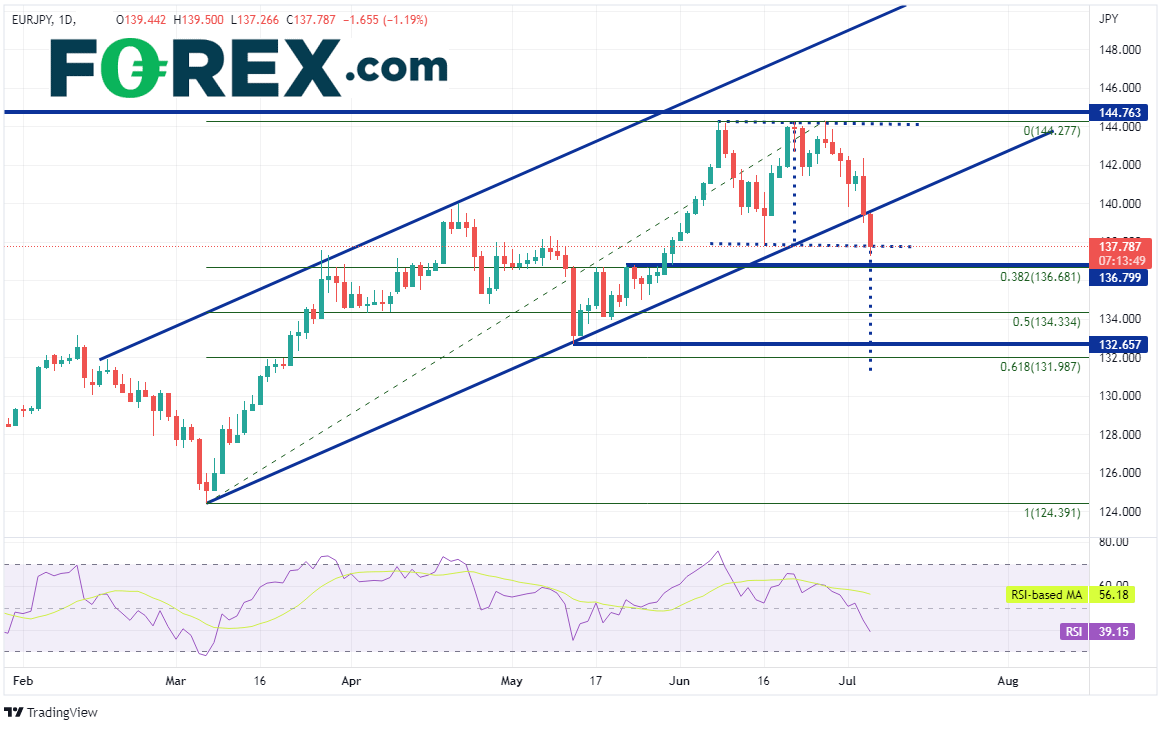
Source: Tradingview, Stone X
On a 240-minute timeframe, there is a confluence of support just below previous resistance and the 38.2% Fibonacci retracement level from the lows of March 7th to the highs from June 28th between 136.68 and 136.80. Below there, EUR/JPY could fall to the 50 % retracement level from the same timeframe near 134.33, then the lows of May 12th at 132.65. However, if EUR/JPY bounces, first resistance is at today’s high and the bottom trendline of the channel near 139.50. Above there, the pair can trade to the July 5th highs at 142.37, then the highs from June 28th at 144.28.
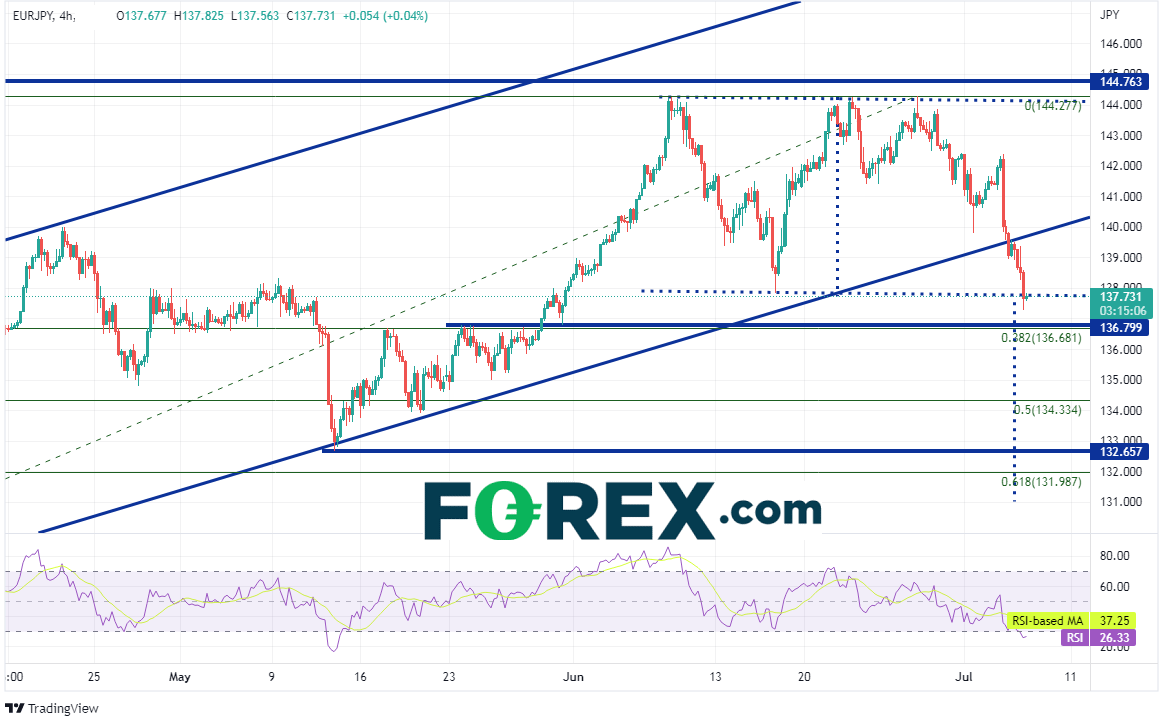
Source: Tradingview, Stone X
If general fears of a recession continue, it may put more pressure on the Euro. In addition to EUR/USD moving lower, EUR/JPY could continue lower as well, as the Yen is also considered a safe haven currency.
The headlines regarding worries of a recession have been coming in fast and furious. The worse than expected PMI headlines 2 weeks ago out of Europe and the US were finalized this week. The European S&P Global Manufacturing PMI Final for June was 52.1 vs 54.6 in May. This was the lowest level since August 2020. The ISM Manufacturing PMI for June was 53 vs 56.1 in May. This was the lowest level since June 2020. Although the US manufacturing data was just as bad as in Europe, traders have been flocking to the US Dollar as a safe haven currency. As a result, EUR/USD has fallen below 102 and appears that it could be on its way to parity.
However, the US Dollar isn’t the only currency that traders are moving to for safety. The Yen is also considered a safe haven. As a result of a weak Euro and a strong Yen, EUR/JPY has been taking a hit over the last few days. Since February 2020, EUR/JPY had been moving higher in an upward sloping channel. The pair made its 2022 low on March 7th at 123.39 and moved higher until June 28th, creating a triple top near 144.27. This is EUR/JPY’s highest level since January 2015. On June 28th, the EUR/JPY began moving lower, and just 1 week later on July 5th, the pair broken below the bottom trendline of the longer-term, upward sloping channel near 139.50. Today, EUR/JPY continues lower and has broken the neckline of the triple top near 137.70. The target for the break of the neckline of a triple top is the height from the top to the neckline, added to the breakdown level. In this case the target is near 131.10.
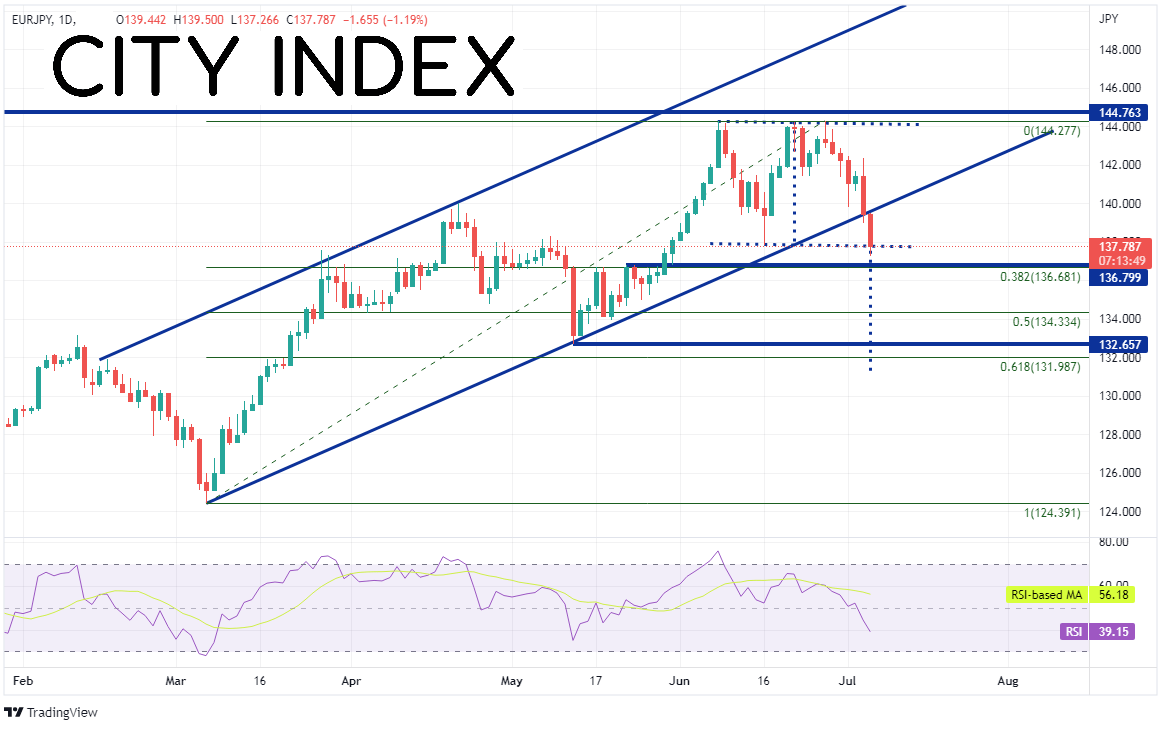
Source: Tradingview, Stone X
Trade EUR/JPY now: Login or Open a new account!
• Open an account in the UK
• Open an account in Australia
• Open an account in Singapore
On a 240-minute timeframe, there is a confluence of support just below previous resistance and the 38.2% Fibonacci retracement level from the lows of March 7th to the highs from June 28th between 136.68 and 136.80. Below there, EUR/JPY could fall to the 50 % retracement level from the same timeframe near 134.33, then the lows of May 12th at 132.65. However, if EUR/JPY bounces, first resistance is at today’s high and the bottom trendline of the channel near 139.50. Above there, the pair can trade to the July 5th highs at 142.37, then the highs from June 28th at 144.28.
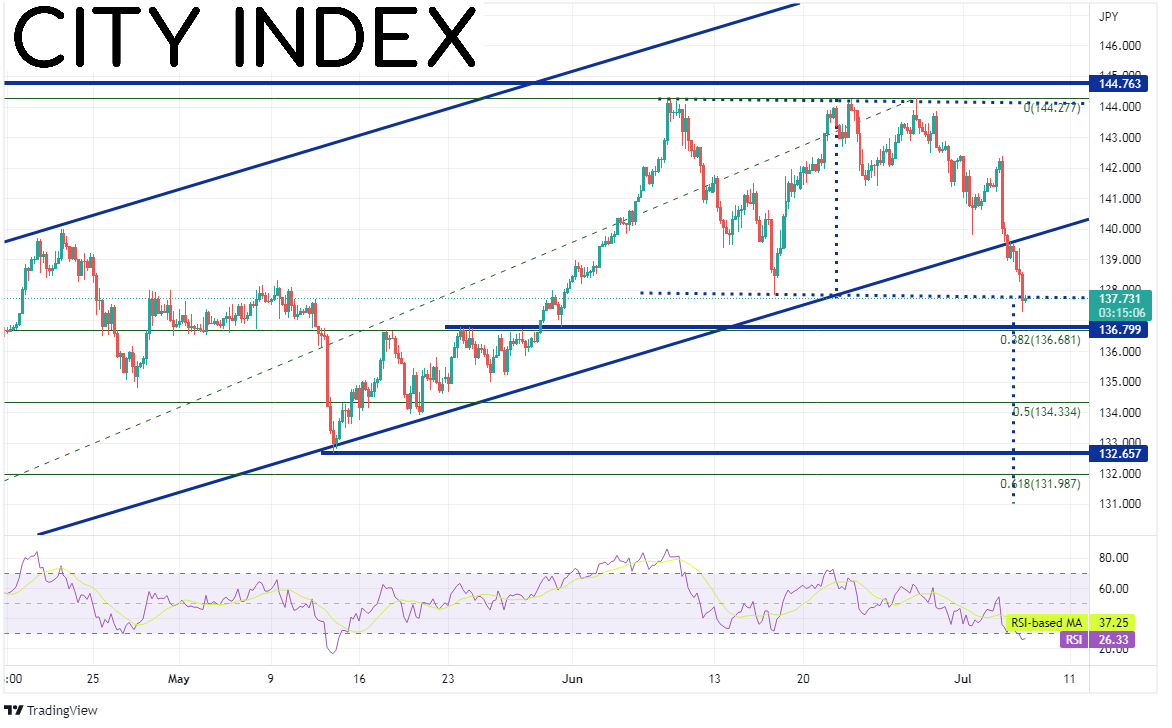
Source: Tradingview, Stone X
If general fears of a recession continue, it may put more pressure on the Euro. In addition to EUR/USD moving lower, EUR/JPY could continue lower as well, as the Yen is also considered a safe haven currency.
Learn more about forex trading opportunities.
Related tags:
Latest market news




The complete CFD trading experience
Award-winning platforms, competitive spreads, low commissions and dedicated support.
We live and breathe the markets and are dedicated to helping traders realise their ambitions as we continue to set the industry bar.
Economic calendar
Web Trader platform
Our sophisticated web-based platform is packed with features.
Related articles
Canadian Dollar Short-term Outlook: USD/CAD Plunge Stalls at Pivotal Support—Range Break in Focus 11 5 2026
Friday’s U.S. and Canadian employment reports could trigger a decisive USD/CAD move as bulls and bears battle for control at critical support.

GBP/USD Forecast: BoE Caution Leaves the Pound Searching for Direction
Although GBP/USD has gained close to 0.5% over the last three trading sessions, reflecting a period of relative strength for the British pound, today's session has started to show a more neutral tone and the bullish momentum seen earlier in the week has begun to slow.

NFP Preview: New Government, Same Jobs Market?
Traders are still sifting through the fallout of the US midterm elections, just in time to get hit with another volatility: The monthly Non-Farm Payrolls (NFP) report - what will the jobs report show, and what could it mean for the US dollar?

StoneX Europe Ltd may make third party material available on this website which may contain information included but not limited to the conditions of financial markets. The material is for information purposes only and does not contain, and should not be construed as containing, investment advice and/or investment recommendation and/or an investment research and/or an offer of or solicitation for any transactions in financial instruments; any decision to enter into a specific transaction shall be made by the client following an assessment by him/her of their situation.
StoneX Europe Ltd makes no representation or warranty and assumes no liability as to the accuracy or completeness of the information provided, nor any loss arising from any investment based on a recommendation, forecast or other information supplied. You should always seek independent advice as to your suitability to speculate in any related markets and your ability to assume the associated risks, if you are at all unsure. We are not under any obligation to update any such material. Any opinion made may be personal to the author and may not reflect the opinion of StoneX Europe Ltd.