



Gold Price Forecast: XAU/USD Bulls Charge Uptrend Resistance as Inflection Risk Rises
Gold is pressing uptrend resistance as XAU/USD stretches to fresh record highs. A reaction here could determine whether the rally extends or pauses. Battle lines drawn.
Share this:

Gold Technical Forecast: XAU/USD Weekly Trade Levels
- Gold prices surged more than 7.2% since the start of the year with XAU/USD extending to fresh record highs
- While momentum remains supportive of the broader advance, price is approaching a level where inflection risk rises, placing emphasis on the weekly close for confirmation.
- Bullish scenario remains viable while above yearly open support, with a sustained close beyond resistance needed to fuel the next major leg of the rally.
- Resistance 4603 (key), ~4800, 4936– Support 4319 (key), 4112, 4000
Gold is pressing into confluent uptrend resistance, with XAU/USD testing a key technical threshold as the rally extends to fresh record highs. This area is reinforced by multiple long-term projections, making it a key checkpoint for the advance. While the broader structure remains constructive and momentum continues to favor the bulls, the approach into this resistance raises the risk of near-term inflection. The response here—particularly into the weekly close—will be important in determining whether gold can transition into another sustained leg higher or pauses to consolidate after an extended run. Battle lines drawn on the XAU/USD weekly technical chart.
Review my latest Weekly Strategy Webinar for an in-depth breakdown of this gold setup and more. Join live on Monday’s at 8:30am EST.
Gold Price Chart – XAU/USD Weekly

Chart Prepared by Michael Boutros, Sr. Technical Strategist; XAU/USD on TradingView
Technical Outlook: In last month’s Gold Technical Forecast we noted that XAU/USD was testing, “resistance at the record high-day close today and the focus is on a reaction off this mark into the close of the year. From a trading standpoint, losses should be limited to 4112 IF price is heading higher on this stretch with a weekly close above 4356 needed to fuel the next leg of the gold rally.” Gold broke higher into the close of the year with the advance extending more than 11.5% off the December lows.
The rally is now pressing into a zone of confluent resistance this week, marked by the 1.618% extension of the December 2024 advance at 4603. This level is further reinforced by the convergence of the 61.8% parallel of the 2025 pitchfork, and the focus is on potential inflection into this slope in the days ahead. A weekly close above this threshold would be needed to keep the immediate advance intact. Keep in mind the weekly relative strength index (RSI) has been in the overbought condition since September, and the momentum profile remains in favor of the bulls for now. Subsequent resistance objectives are eyed at the upper parallel of the 2025 pitchfork (currently near ~4800) backed by the 2.618% extension of the October advance at 4936 and 5000.
Yearly open support rests at 4319 and is backed by bullish invalidation at the October high-week close at 4112. Note that this level converges on the lower parallel into the close of the month and losses below this threshold would be needed to suggest a more significant high is in place and a larger trend reversal is underway.

Bottom line: Gold is attempting to mount confluent uptrend resistance this week and a close above 4603 is needed to keep the bulls in control. From a trading standpoint, losses should be limited to the yearly open IF price is heading higher on this stretch with a close above slope resistance needed to fuel the next major leg of the advance.
Keep in mind we get the release of Fed’s preferred inflationary gauge next week with November Personal Consumption Expenditures (PCE) on tap Thursday. On the back of this week’s better-than-expected CPI print, the data will be critical in determining the timing of the central bank’s next rate cut. Markets are currently pricing a 65% probability for the first rate cut of the year to be at the June decision, and a slower pace of price growth has the potential to bring expectations closer to April and further fuel the gold rally. Stay nimble into the releases and watch the weekly close for guidance here. I’ll publish an updated Gold Short-term Outlook once we get further clarity on the near-term XAU/USD technical trade levels.
Key US Economic Data Releases
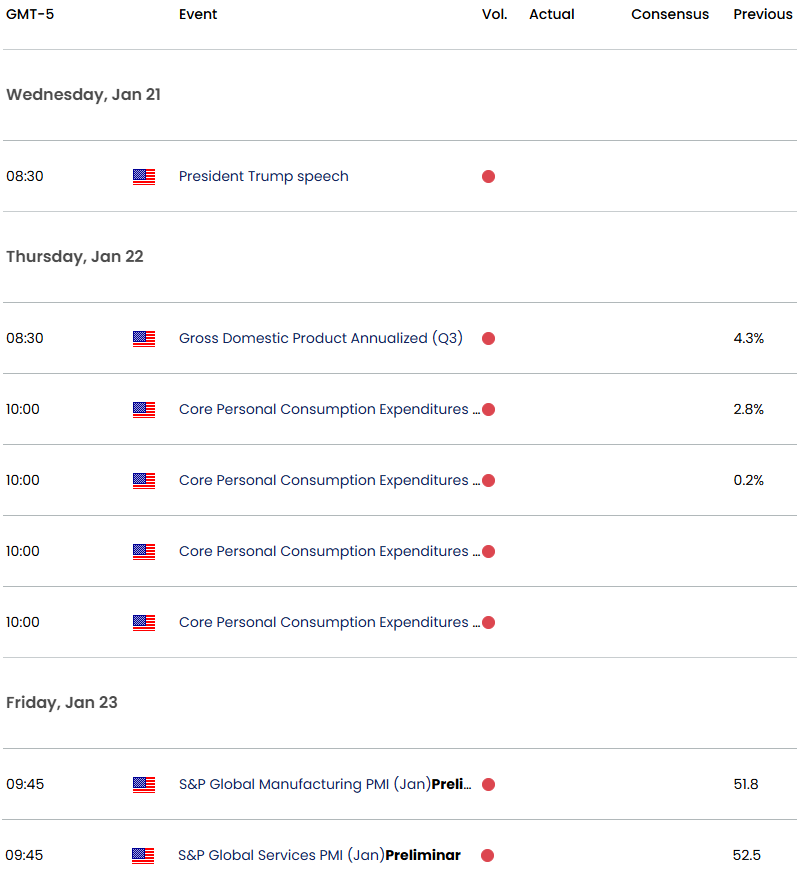
Economic Calendar - latest economic developments and upcoming event risk.
Active Weekly Technical Charts
- Crude Oil (WTI)
- Euro (EUR/USD)
- Canadian Dollar (USD/CAD)
- Japanese Yen (USD/JPY)
- Bitcoin (BTC/USD)
- Australian Dollar (AUD/USD)
- British Pound (GBP/USD)
- US Dollar Index (DXY)
- Swiss Franc (USD/CHF)
- S&P 500, Nasdaq, Dow
--- Written by Michael Boutros, Senior Technical Strategist
Follow Michael on X @MBForex
Latest market news




The complete CFD trading experience
Award-winning platforms, competitive spreads, low commissions and dedicated support.
We live and breathe the markets and are dedicated to helping traders realise their ambitions as we continue to set the industry bar.
Economic calendar
Web Trader platform
Our sophisticated web-based platform is packed with features.
Related articles
USD/JPY Weekly Outlook: AI earnings could overshadow the Fed and BoJ
AI sentiment has become a major driver of US Treasury yields and USD/JPY. With Microsoft, Alphabet and Amazon reporting this week, central bank decisions may have competition for traders' attention.
Silver forecast: metals liquidation drags XAG/USD into $50-55 support
Silver has broken its July low and slipped into a long-term support zone as the selling in precious metals deepens. The chart shows where the metal could bottom, and next week's Fed decision may decide whether it does.

Australian Dollar Forecast: AUD/USD Support Reversal Sparks Monthly Range Breakout 10 23 2026
A sharp reversal off key support has fueled the AUD/USD recovery, with resistance now in focus ahead of next week’s Fed decision and Australian CPI.
StoneX Europe Ltd may make third party material available on this website which may contain information included but not limited to the conditions of financial markets. The material is for information purposes only and does not contain, and should not be construed as containing, investment advice and/or investment recommendation and/or an investment research and/or an offer of or solicitation for any transactions in financial instruments; any decision to enter into a specific transaction shall be made by the client following an assessment by him/her of their situation.
StoneX Europe Ltd makes no representation or warranty and assumes no liability as to the accuracy or completeness of the information provided, nor any loss arising from any investment based on a recommendation, forecast or other information supplied. You should always seek independent advice as to your suitability to speculate in any related markets and your ability to assume the associated risks, if you are at all unsure. We are not under any obligation to update any such material. Any opinion made may be personal to the author and may not reflect the opinion of StoneX Europe Ltd.