



Intuitive Surgical Waiting a Breakout of Flag Pattern
Intuitive Surgical (ISRG), surgical systems and machine manufacturer, remains trading around its record high level.
Share this:
Intuitive Surgical (ISRG), surgical systems and machine manufacturer, remains trading around its record high level.
Last month, Intuitive Surgical reported that 2Q EPS slumped 79% on year to $0.57 on revenue of $852 million, down 23%. The company said the reduction of earnings as its surgery device was used less during the pandemic and decreased shipments of the machines.
Even the 2Q income sharply dropped, the stock prices are able to keep at this high level. It would suggest that investors would expect the continuation of rapid growth when the economic environment is back to normal.
From a technical point of view, the stock is trading within the flag pattern after rising to the record high level at $704. The relative strength index stays around the 60s, suggesting that the upward momentum remains. Investors should focus on the breakout signal of the flag pattern for another up move.
Bullish readers could set the support level at $640 (38.2% fibonacci retracement level), while resistance levels would be located at $765 (138.2% fibonacci expansion) and $804 (161.8% Fibonacci expansion).

Source: GAIN Capital, TradingVIew
Last month, Intuitive Surgical reported that 2Q EPS slumped 79% on year to $0.57 on revenue of $852 million, down 23%. The company said the reduction of earnings as its surgery device was used less during the pandemic and decreased shipments of the machines.
Even the 2Q income sharply dropped, the stock prices are able to keep at this high level. It would suggest that investors would expect the continuation of rapid growth when the economic environment is back to normal.
From a technical point of view, the stock is trading within the flag pattern after rising to the record high level at $704. The relative strength index stays around the 60s, suggesting that the upward momentum remains. Investors should focus on the breakout signal of the flag pattern for another up move.
Bullish readers could set the support level at $640 (38.2% fibonacci retracement level), while resistance levels would be located at $765 (138.2% fibonacci expansion) and $804 (161.8% Fibonacci expansion).
Source: GAIN Capital, TradingVIew
Intuitive Surgical (ISRG), surgical systems and machine manufacturer, remains trading around its record high level.
Last month, Intuitive Surgical reported that 2Q EPS slumped 79% on year to $0.57 on revenue of $852 million, down 23%. The company said the reduction of earnings as its surgery device was used less during the pandemic and decreased shipments of the machines.
Even the 2Q income sharply dropped, the stock prices are able to keep at this high level. It would suggest that investors would expect the continuation of rapid growth when the economic environment is back to normal.
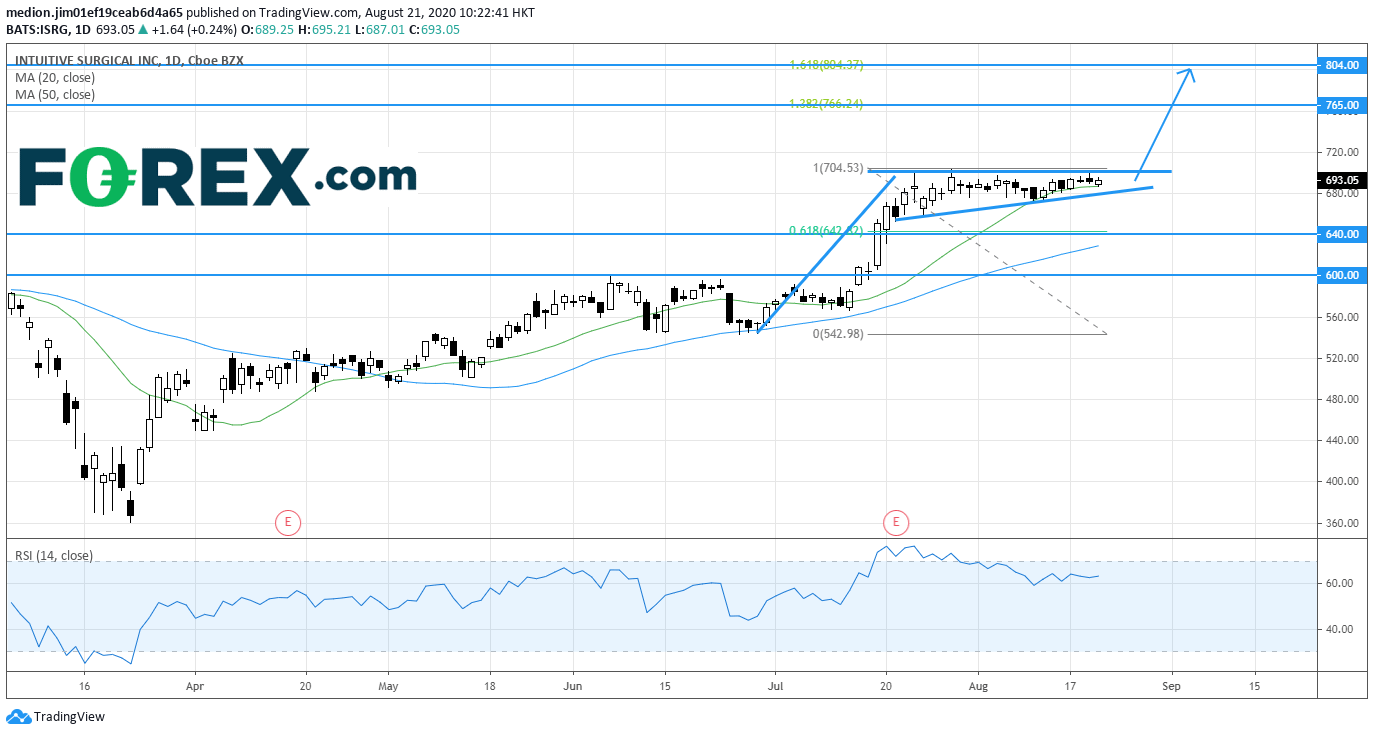
From a technical point of view, the stock is trading within the flag pattern after rising to the record high level at $704. The relative strength index stays around the 60s, suggesting that the upward momentum remains. Investors should focus on the breakout signal of the flag pattern for another up move.
Bullish readers could set the support level at $640 (38.2% fibonacci retracement level), while resistance levels would be located at $765 (138.2% fibonacci expansion) and $804 (161.8% Fibonacci expansion).
Source: GAIN Capital, TradingVIew
Last month, Intuitive Surgical reported that 2Q EPS slumped 79% on year to $0.57 on revenue of $852 million, down 23%. The company said the reduction of earnings as its surgery device was used less during the pandemic and decreased shipments of the machines.
Even the 2Q income sharply dropped, the stock prices are able to keep at this high level. It would suggest that investors would expect the continuation of rapid growth when the economic environment is back to normal.
From a technical point of view, the stock is trading within the flag pattern after rising to the record high level at $704. The relative strength index stays around the 60s, suggesting that the upward momentum remains. Investors should focus on the breakout signal of the flag pattern for another up move.
Bullish readers could set the support level at $640 (38.2% fibonacci retracement level), while resistance levels would be located at $765 (138.2% fibonacci expansion) and $804 (161.8% Fibonacci expansion).
Source: GAIN Capital, TradingVIew
Related tags:
Latest market news




The complete CFD trading experience
Award-winning platforms, competitive spreads, low commissions and dedicated support.
We live and breathe the markets and are dedicated to helping traders realise their ambitions as we continue to set the industry bar.
Economic calendar
Web Trader platform
Our sophisticated web-based platform is packed with features.
Related articles

Nasdaq Breakout Potential into Q4 for Melt Up Scenarios
The headlines seem negative in almost any place that you look, with surging Treasury yields and frothy AI valuations getting more and more attention. But, if it’s so bad, why hasn’t the Nasdaq melted down yet, even as the Fed has started hiking rates?


Nikkei threatens breakout as tech rebound broadens
Breakouts across the SOX and Nasdaq are being matched by rebounds across Asia, with the Nikkei now threatening to join the move.


S&P 500, Nasdaq 100 Forecast for the Week Ahead
A hawkish Fed and 10-Year Notes on the verge of a push above 5%, yet stocks have so far shrugged off that fear. But can it continue?
StoneX Europe Ltd may make third party material available on this website which may contain information included but not limited to the conditions of financial markets. The material is for information purposes only and does not contain, and should not be construed as containing, investment advice and/or investment recommendation and/or an investment research and/or an offer of or solicitation for any transactions in financial instruments; any decision to enter into a specific transaction shall be made by the client following an assessment by him/her of their situation.
StoneX Europe Ltd makes no representation or warranty and assumes no liability as to the accuracy or completeness of the information provided, nor any loss arising from any investment based on a recommendation, forecast or other information supplied. You should always seek independent advice as to your suitability to speculate in any related markets and your ability to assume the associated risks, if you are at all unsure. We are not under any obligation to update any such material. Any opinion made may be personal to the author and may not reflect the opinion of StoneX Europe Ltd.