





Japanese Yen Technical Analysis: USD/JPY Sellers Still Grinding Lower
USD/JPY has been in a consistent sell-off for most of the year, but sellers still haven’t been able to run a breakdown resembling last summer’s carry unwind event.
Share this:

Japanese Yen Talking Points:
- USD/JPY continues to see a grinding sell-off with bears seemingly unable to run for long after prints of fresh lows.
- It’s the 61.8% retracement of the recent bounce that’s holding the lows for now, marking support around the 147.00 handle as I had looked at last Thursday.
Last summer saw a mass purge of longs from USD/JPY as the carry trade unwound with a vengeance, leading to a de-leveraging event across global markets.
The reason behind the push was fairly clear: The Fed was preparing to cut rates for the first time since 2020 and the Bank of Japan had already hiked rates, and inflation had continued at a high pace in Japan so logically, the rate divergence that had propelled the pair to multi-decade highs would further compress in the months to come. That gave reason for carry trades to unwind and as that happened, so did many of the asset classes that were boosted by borrowing at cheap rates in Japan.
It took a little over a month for matters to settle, with the VIX spike on August 5th leading to a bounce in stocks but USD/JPY continued to grind-lower until it had a single day of testing below the 140.00 handle in mid-September. Sellers failed to capitalize then and a couple days later, when the Fed did finally cut rates, USD/JPY made a higher-low and started to bounce a bit higher. And then in Q4 when the USD comeback took over USD/JPY went along for the ride, with some even proclaiming that it was ‘the return of the carry trade,’ even as the Federal Reserve was continuing to cut rates.
There was some help from Japanese inflation, however, as the inflation settled and removed some fears about how aggressive the Bank of Japan might be with rate hikes. But, so far this year, it’s been a grinding bear market in USD/JPY that’s seen about 61.8% of that prior bounce from last year erased. But, as looked at last week, it hasn’t been a decisive, one-sided move like we saw last year, and there’s been several bear traps along the way.
USD/JPY Daily Chart
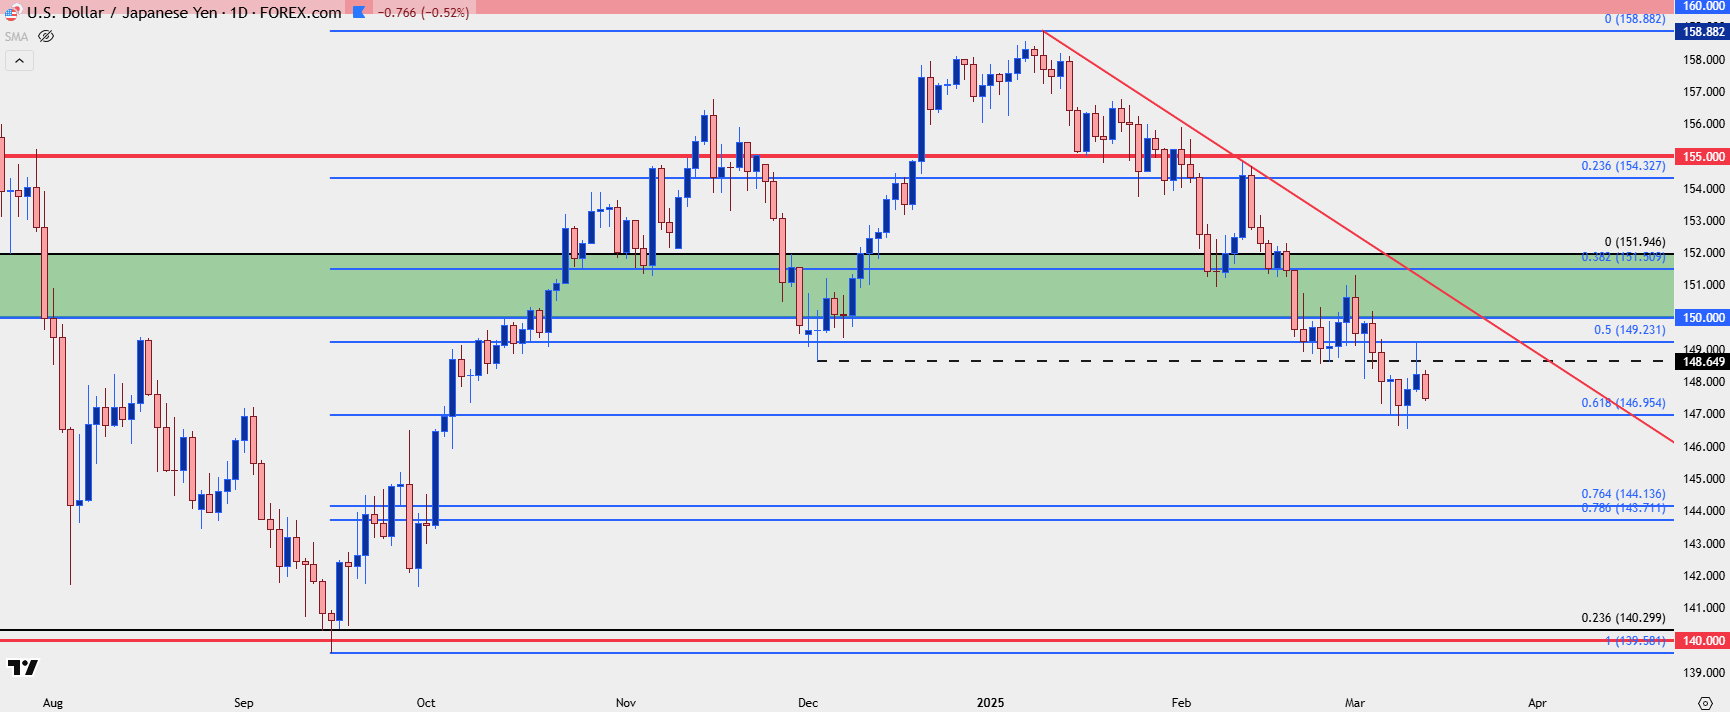 Chart prepared by James Stanley; data derived from Tradingview
USD/JPY: The Big Picture
With fears of recession surrounding the U.S. economy it can be increasingly difficult to muster a bullish case on the fundamental side of USD/JPY at the moment. Also combined with the longer-term position of the pair, which remains well-elevated above the 110’s and 115’s that were commonplace before the pandemic, or the sub-103 level that was in-play in early-2021 before the carry trade trend really got started.
With supply and demand being the push point for price moves, it can be reasoned that many carry traders are still holding on the long side of the move, which would mean that there could be a steeper fall if we did see a larger episode of carry unwind take-over, similar to the moves in Q4 of 2022 or 2023, or the move we saw develop in summer of last year.
But, notably, despite a seemingly open door for bears to make that push with the current fundamental backdrop, they’ve failed to do so, at least so far.
USD/JPY Weekly Price Chart
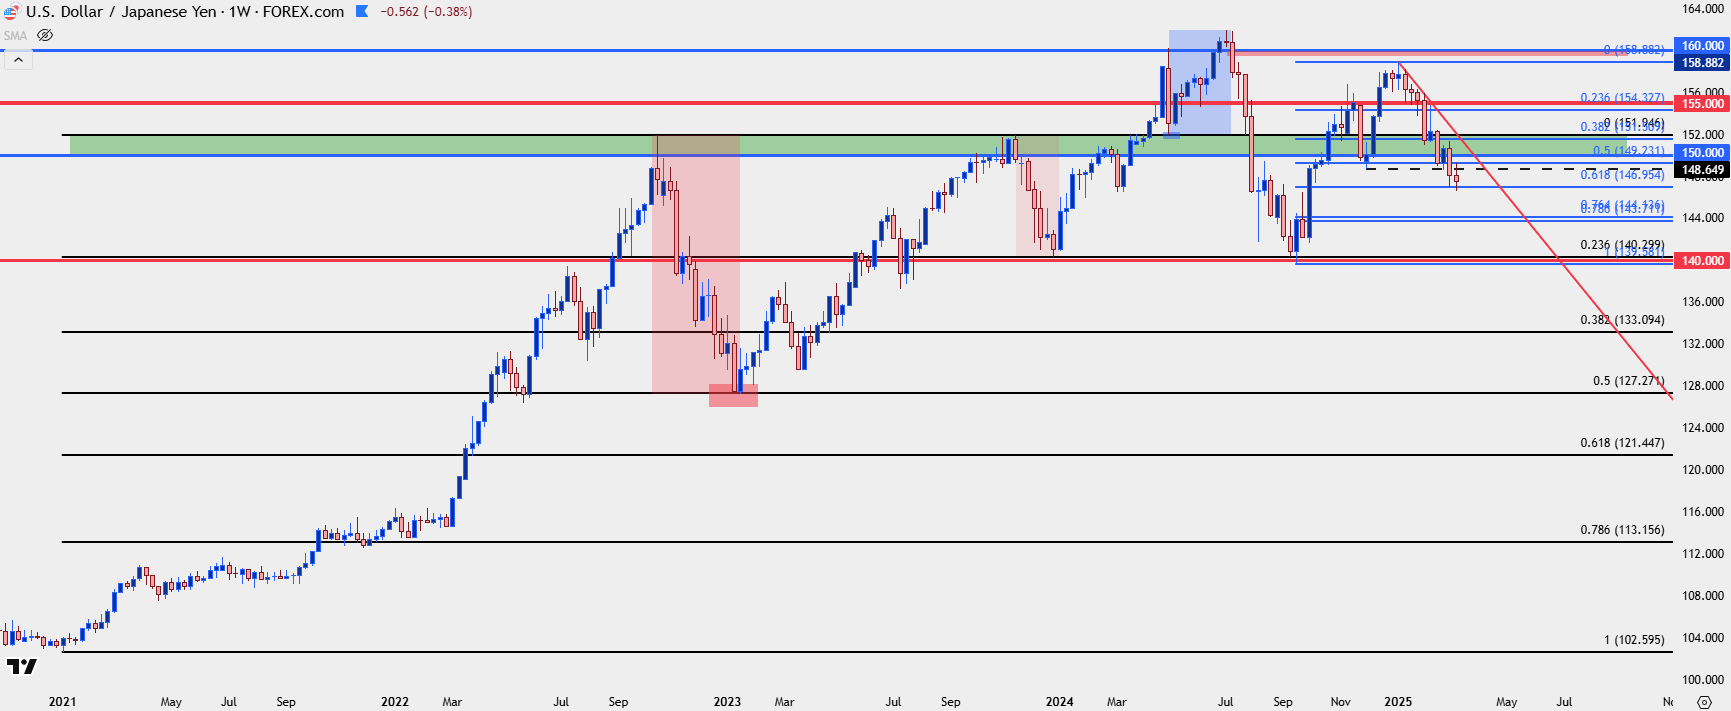 Chart prepared by James Stanley; data derived from Tradingview
USD/JPY Strategy
While another carry unwind event certainly can’t be ruled out, the number of bear traps that have brewed along the way for this year can urge caution from chasing breakout attempts in USD/JPY. And correspondingly, it can also make more attractive the premise of lower-high resistance, particularly at a prior spot of support such as we’ve seen with this week’s high plotting at the Fibonacci level of 149.23, or prior swing highs at the 150.00 level of the 151.05 prior swing low.
This would set the stage for potential lower-high resistance at the prior swing-low of 148.10. which would be aggressive, or the 148.65 level that set the low in December before coming in as support in February. That price hasn’t yet shown much for resistance, but if it does, it could be an item of interest for bearish continuation strategies in the pair.
USD/JPY Daily Price Chart
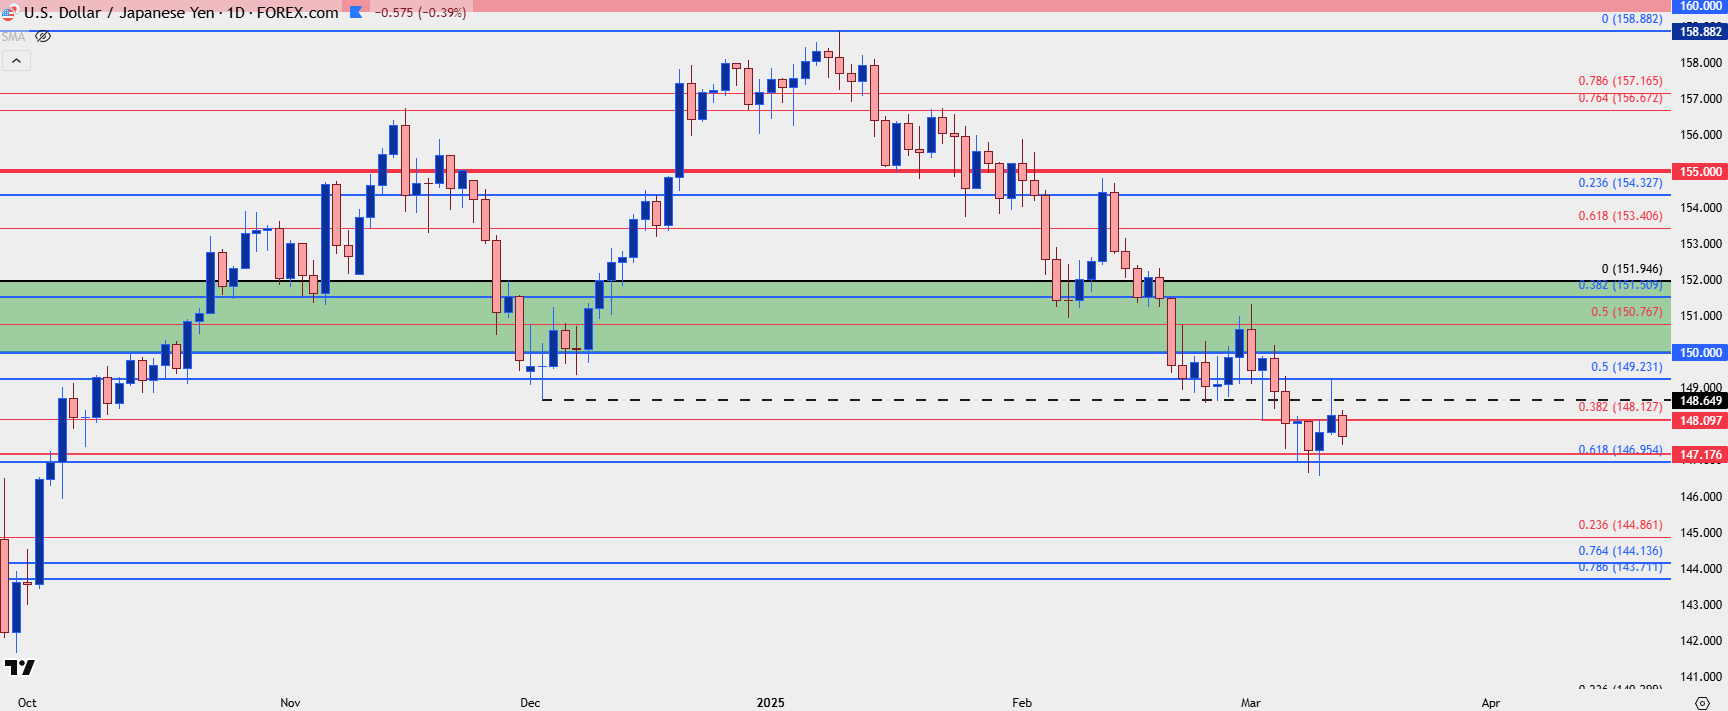 Chart prepared by James Stanley; data derived from Tradingview
--- written by James Stanley, Senior Strategist
Japanese Yen Talking Points:
- USD/JPY continues to see a grinding sell-off with bears seemingly unable to run for long after prints of fresh lows.
- It’s the 61.8% retracement of the recent bounce that’s holding the lows for now, marking support around the 147.00 handle as I had looked at last Thursday.
Last summer saw a mass purge of longs from USD/JPY as the carry trade unwound with a vengeance, leading to a de-leveraging event across global markets.
The reason behind the push was fairly clear: The Fed was preparing to cut rates for the first time since 2020 and the Bank of Japan had already hiked rates, and inflation had continued at a high pace in Japan so logically, the rate divergence that had propelled the pair to multi-decade highs would further compress in the months to come. That gave reason for carry trades to unwind and as that happened, so did many of the asset classes that were boosted by borrowing at cheap rates in Japan.
It took a little over a month for matters to settle, with the VIX spike on August 5th leading to a bounce in stocks but USD/JPY continued to grind-lower until it had a single day of testing below the 140.00 handle in mid-September. Sellers failed to capitalize then and a couple days later, when the Fed did finally cut rates, USD/JPY made a higher-low and started to bounce a bit higher. And then in Q4 when the USD comeback took over USD/JPY went along for the ride, with some even proclaiming that it was ‘the return of the carry trade,’ even as the Federal Reserve was continuing to cut rates.
There was some help from Japanese inflation, however, as the inflation settled and removed some fears about how aggressive the Bank of Japan might be with rate hikes. But, so far this year, it’s been a grinding bear market in USD/JPY that’s seen about 61.8% of that prior bounce from last year erased. But, as looked at last week, it hasn’t been a decisive, one-sided move like we saw last year, and there’s been several bear traps along the way.
USD/JPY Daily Chart
USD/JPY: The Big Picture
With fears of recession surrounding the U.S. economy it can be increasingly difficult to muster a bullish case on the fundamental side of USD/JPY at the moment. Also combined with the longer-term position of the pair, which remains well-elevated above the 110’s and 115’s that were commonplace before the pandemic, or the sub-103 level that was in-play in early-2021 before the carry trade trend really got started.
With supply and demand being the push point for price moves, it can be reasoned that many carry traders are still holding on the long side of the move, which would mean that there could be a steeper fall if we did see a larger episode of carry unwind take-over, similar to the moves in Q4 of 2022 or 2023, or the move we saw develop in summer of last year.
But, notably, despite a seemingly open door for bears to make that push with the current fundamental backdrop, they’ve failed to do so, at least so far.
USD/JPY Weekly Price Chart
USD/JPY Strategy
While another carry unwind event certainly can’t be ruled out, the number of bear traps that have brewed along the way for this year can urge caution from chasing breakout attempts in USD/JPY. And correspondingly, it can also make more attractive the premise of lower-high resistance, particularly at a prior spot of support such as we’ve seen with this week’s high plotting at the Fibonacci level of 149.23, or prior swing highs at the 150.00 level of the 151.05 prior swing low.
This would set the stage for potential lower-high resistance at the prior swing-low of 148.10. which would be aggressive, or the 148.65 level that set the low in December before coming in as support in February. That price hasn’t yet shown much for resistance, but if it does, it could be an item of interest for bearish continuation strategies in the pair.
USD/JPY Daily Price Chart
--- written by James Stanley, Senior Strategist
Related tags:



The complete CFD trading experience
Award-winning platforms, competitive spreads, low commissions and dedicated support.
We live and breathe the markets and are dedicated to helping traders realise their ambitions as we continue to set the industry bar.
Economic calendar
Web Trader platform
Our sophisticated web-based platform is packed with features.
Related articles

USD Sets Fresh Yearly High as EUR/USD Drops Dramatically, USD/JPY Stable
Well, it was a week of USD strength that wasn’t entirely pushed by USD/JPY, as a strong sell-off in EUR/USD has pushed the major pair to its most oversold state in a decade.

Gold Price Outlook: XAU/USD Resistance at $4200 Sets Up for NFP
It was a strong sell-off to start the week in gold and despite a Tuesday bounce, sellers are continuing to push following a resistance hit at the $4200 level.

Nasdaq Breakout Potential into Q4 for Melt Up Scenarios
The headlines seem negative in almost any place that you look, with surging Treasury yields and frothy AI valuations getting more and more attention. But, if it’s so bad, why hasn’t the Nasdaq melted down yet, even as the Fed has started hiking rates?
StoneX Europe Ltd may make third party material available on this website which may contain information included but not limited to the conditions of financial markets. The material is for information purposes only and does not contain, and should not be construed as containing, investment advice and/or investment recommendation and/or an investment research and/or an offer of or solicitation for any transactions in financial instruments; any decision to enter into a specific transaction shall be made by the client following an assessment by him/her of their situation.
StoneX Europe Ltd makes no representation or warranty and assumes no liability as to the accuracy or completeness of the information provided, nor any loss arising from any investment based on a recommendation, forecast or other information supplied. You should always seek independent advice as to your suitability to speculate in any related markets and your ability to assume the associated risks, if you are at all unsure. We are not under any obligation to update any such material. Any opinion made may be personal to the author and may not reflect the opinion of StoneX Europe Ltd.