




S&P 500, Nasdaq, Dow Forecast for the Week Ahead
Stocks sold off after the CPI report but a threat to fire Powell on Wednesday helped to arrest the declines.
Share this:

S&P 500, Nasdaq, Dow Talking Points:
- The CPI report on Tuesday induced a sell-off in stocks but that was short-lived as President Trump threatened to fire Jerome Powell a day later.
- While Trump may not be able to fire Powell immediately, it’s clear that the U.S. President wants a more dovish Fed chair, and that can happen when Powell’s term concludes in May of next year.
- Nonetheless, given the reaction in stocks this week we can walk away with an idea of what could produce a pullback, and with the Fed meeting set for the Wednesday after next, that could open the door to opportunity.
We saw a brief glimpse of the ‘good is bad’ theme peak out last week. On Tuesday morning U.S. inflation came in above expected via headline with Core pushing closer to 3%, which is somewhat illustrative of strength in the U.S. economy, the same strength that has so far disallowed the Fed from cutting rates. And it’s that very hope for rate cuts which was diminished after the data was released that helped to bring a sell-off to equities. The Tuesday session was grinding and bearish, and that led into a spike-lower on Wednesday.
In the Tuesday webinar I warned that we might see something from President Trump on the topic of Jerome Powell’s employment. With USD rallying in the aftermath of the CPI report and equities tilting-lower, the fear was building that the Fed may be even further away from rate cuts than previously hoped. To be sure, Jerome Powell hasn’t sounded all too dovish so far this year, instead saying that he though tariffs would produce inflation that could put the Fed in the uncomfortable spot of being unable to stoke slow growth because of inflation remaining too high.
At this point bullish continuation in equities is a challenge just because of how few pullbacks have shown of late. After the spill in early-Q2, the market’s response around tariffs has seemed to be considerably more positive, driven by the idea that Trump would not up-end the economy. The Fed, however, still hasn’t given markets the dovish drive that they’ve been hoping for and given the reaction last week, where prices pulled back briefly on the back of CPI, we can deduce that a more-hawkish Fed could possibly produce some pullback in stocks.
In the S&P 500, the 6234 level has been the line in the sand and that’s what was defended as support last week. Below that, 6173 is of note as this was a spot of resistance-turned-support, and below that, 6145 is a level with some longer-term importance as that’s the 100% measured move of the 2022 pullback and it’s also what came in to hold highs in February before the tariff-induced sell-off.
If pullbacks can drive below that, which we have to open as a possibility given just how overbought the move has become, then there’s some remaining unfilled gap down to 6025.
S&P 500 Daily Price Chart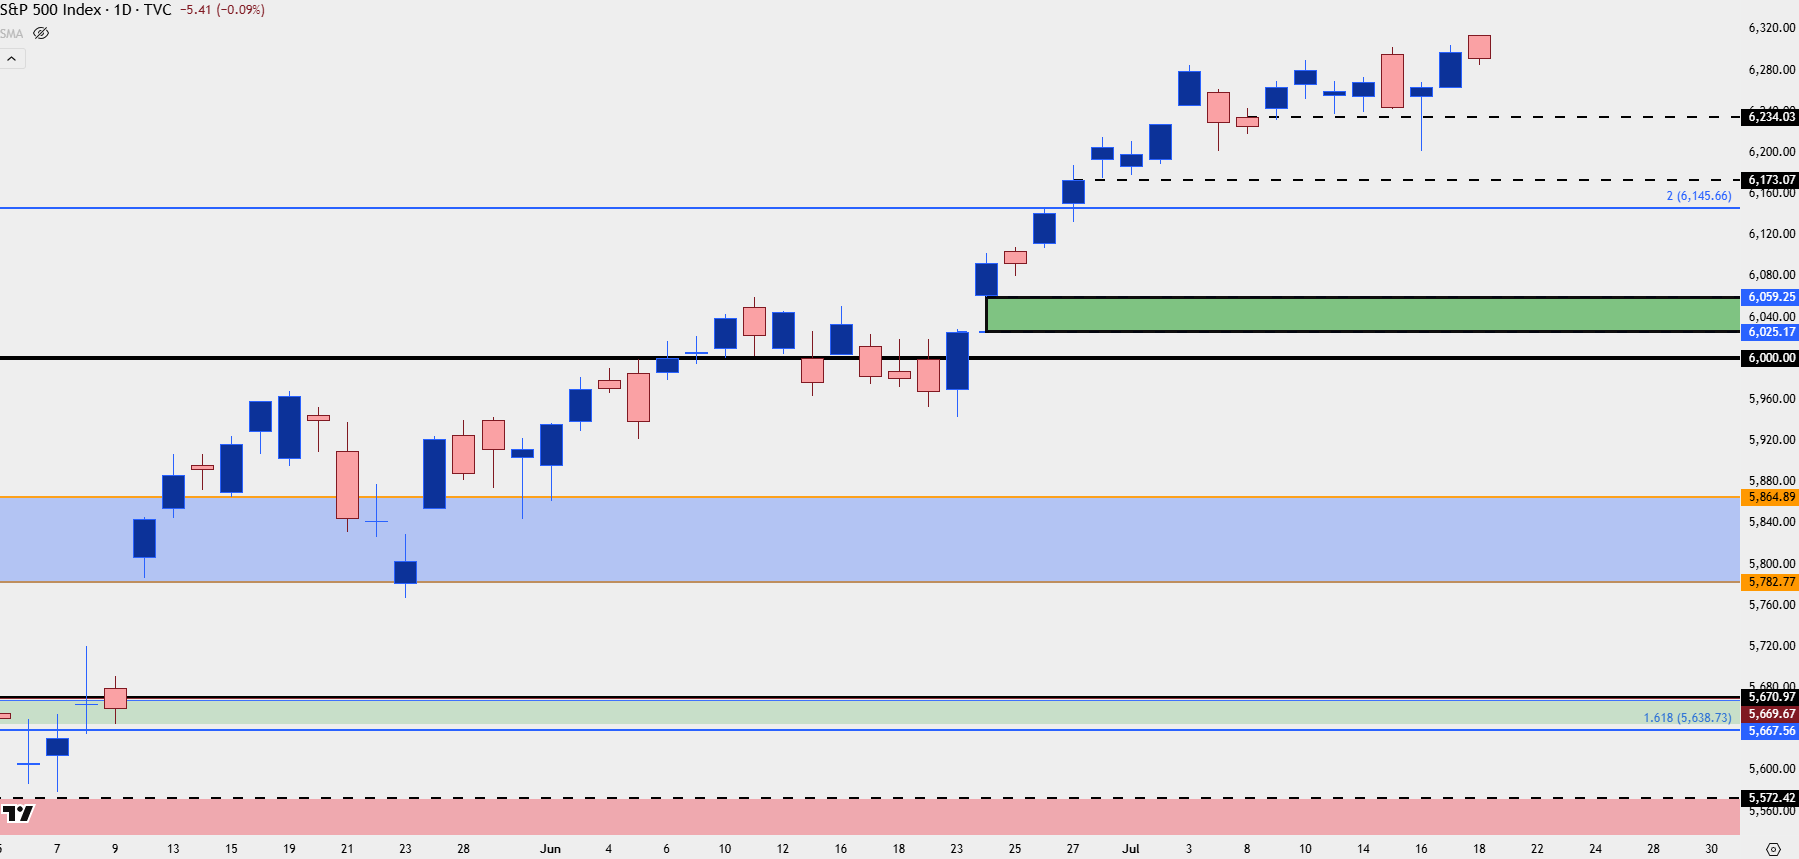
Chart prepared by James Stanley; data derived from Tradingview
Nasdaq
The Nasdaq is in a very similar spot as the above with the S&P 500 as both indices ran up to fresh all-time-highs on Friday morning. The weekly low in NDX printed right at a key spot at 22,679 which is a prior spot of resistance-turned-support. That’s the level that bulls would need to retain to keep control of near-term momentum, and if they lose it, it’s a somewhat messy backdrop until we get down to the unfilled gap that runs from 21,856-22,045 which, perhaps coincidentally, came into play after Michelle Bowman’s comment talking up a July rate cut that really doesn’t seem very likely.
Nasdaq 100 Daily Chart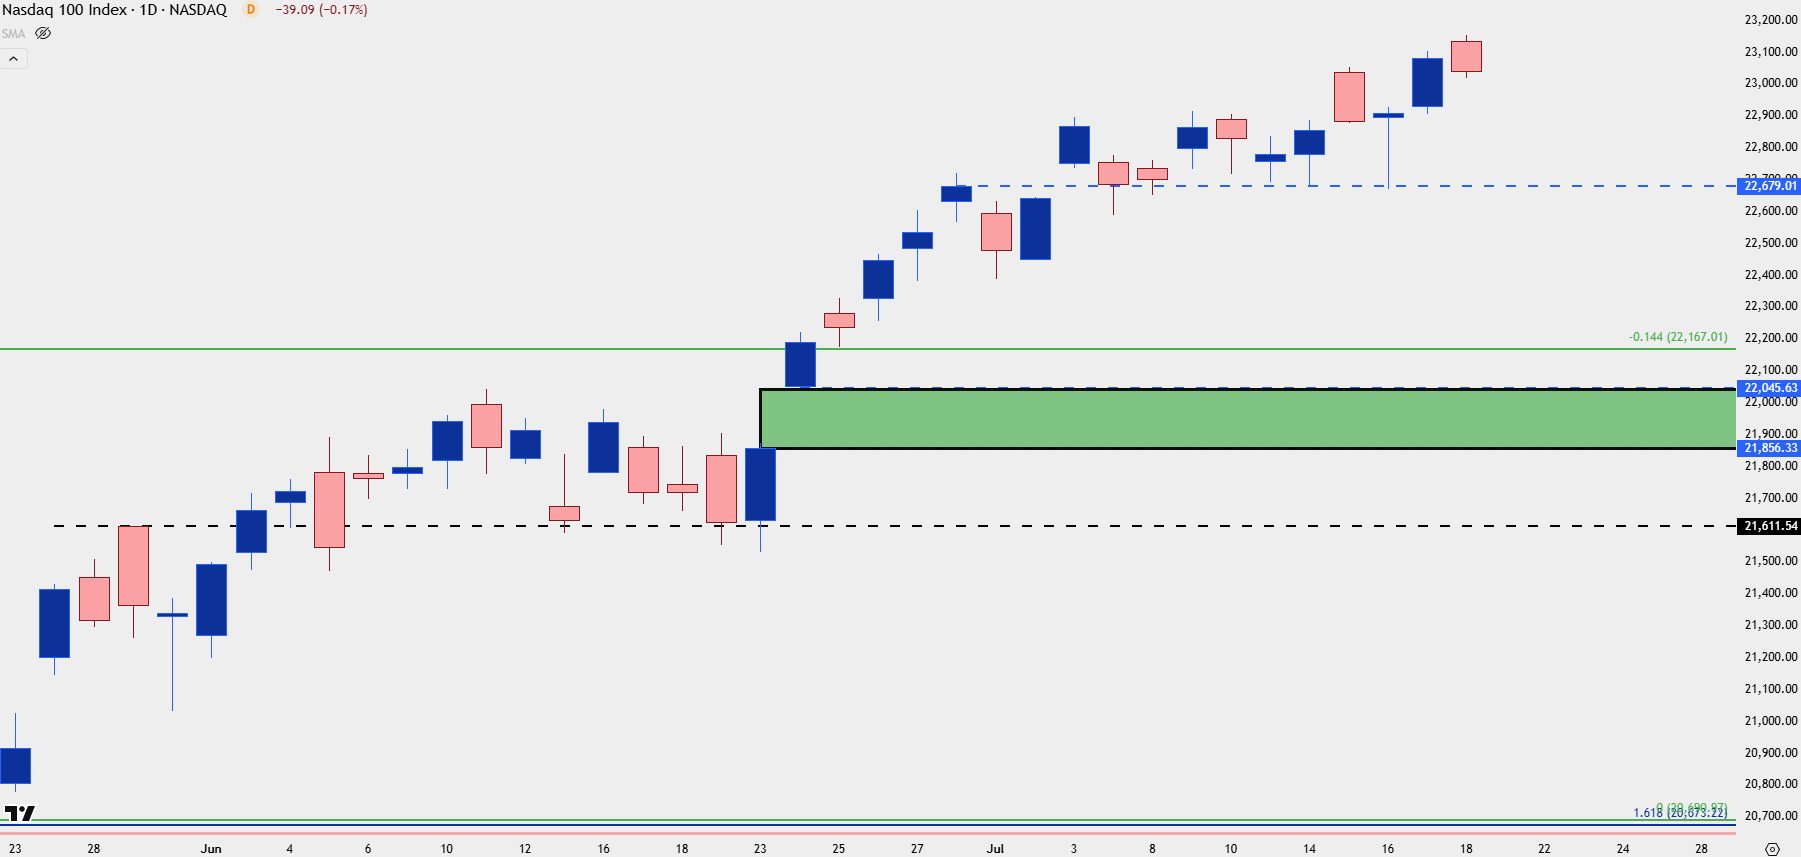
Chart prepared by James Stanley; data derived from Tradingview
Dow Jones
The Dow is an outlier from the above two markets as that index did not set a fresh all-time-high last week. Instead, the index continued to posture below the psychological level of 45,000 which it still hasn’t been able to produce a closed body break on the weekly.
Interestingly, this is the index that could probably have a more bullish argument than the above two markets because of that, also combined with the pullback and indecision on the weekly bar after the gap from June was finally filled. That sets the stage for a possible test of 45k as we move towards the July rate decision on the Wednesday after next.
Dow Jones Weekly Chart
Chart prepared by James Stanley; data derived from Tradingview
Dow Daily
The daily chart of the Dow can offer some additional context as the support at 43,819 is somewhat of a line in the sand. A pullback to and show of support at 44,025 keeps the door open for bullish continuation, but if sellers break through 43,819, the net significant spot of support doesn’t appear until the 43,386-43,505 zone.
Dow Jones Daily Price Chart
Chart prepared by James Stanley; data derived from Tradingview
--- written by James Stanley, Senior Strategist
Latest market news




The complete CFD trading experience
Award-winning platforms, competitive spreads, low commissions and dedicated support.
We live and breathe the markets and are dedicated to helping traders realise their ambitions as we continue to set the industry bar.
Economic calendar
Web Trader platform
Our sophisticated web-based platform is packed with features.
Related articles
Equity Indices Q4, 2026 Outlook: Cracks Begin to Show
There's still an open door for a melt-up in the S&P 500 and Nasdaq but the Dow and Russell 2000 are looking more vulnerable, and until calm hits the Treasuries market there's a higher probability for volatility. The big question is whether that's a next quarter theme or not.
S&P 500 Forecast: SPX rises as oil prices fall, but treasuries remain at multi-decade highs
U.S. stocks are rising on Friday after a volatile week that saw a surge in Treasury yields ripple through financial markets.


Bitcoin Tests Support as Gold Rally Falls Flat, Falls to FOMC Lows
Surging yields and higher rate hike odds present a new wrinkle for markets, and this has softened the trend in gold. Bitcoin, meanwhile, has retained strong bullish structure and continues to show a brighter backdrop than XAU/USD.
StoneX Europe Ltd may make third party material available on this website which may contain information included but not limited to the conditions of financial markets. The material is for information purposes only and does not contain, and should not be construed as containing, investment advice and/or investment recommendation and/or an investment research and/or an offer of or solicitation for any transactions in financial instruments; any decision to enter into a specific transaction shall be made by the client following an assessment by him/her of their situation.
StoneX Europe Ltd makes no representation or warranty and assumes no liability as to the accuracy or completeness of the information provided, nor any loss arising from any investment based on a recommendation, forecast or other information supplied. You should always seek independent advice as to your suitability to speculate in any related markets and your ability to assume the associated risks, if you are at all unsure. We are not under any obligation to update any such material. Any opinion made may be personal to the author and may not reflect the opinion of StoneX Europe Ltd.