




S&P 500 Forecast: Stocks Grind as Yields Jump into the Election, FOMC
S&P 500 futures pulled back again last week and as yields have continued their run-higher, there’s more potential for greater pullbacks ahead. Both the election and FOMC can bring impact on both fronts.
Share this:

S&P 500 Talking Points:
- The S&P 500 has been close to flat since the Q4 open, but it has held on to the bounce that showed after the September rate cut from the FOMC.
- As I wrote in the Q4 Forecast, pullbacks can remain attractive for positioning into US equities and this week showed two reactions to support that couldn’t continue into fresh trends. So swings have remained in-play but bulls haven’t yet appeared ready to drive fresh topside trends.
- To access that forecast in its entirety, the link below can set that up:
US Treasury Yields continued to push higher this week but at this point, stocks haven’t seemed too perturbed by that. We are seeing a second consecutive red week for S&P 500 futures but the sell-off thus far has been fairly controlled, with bounces showing at support.
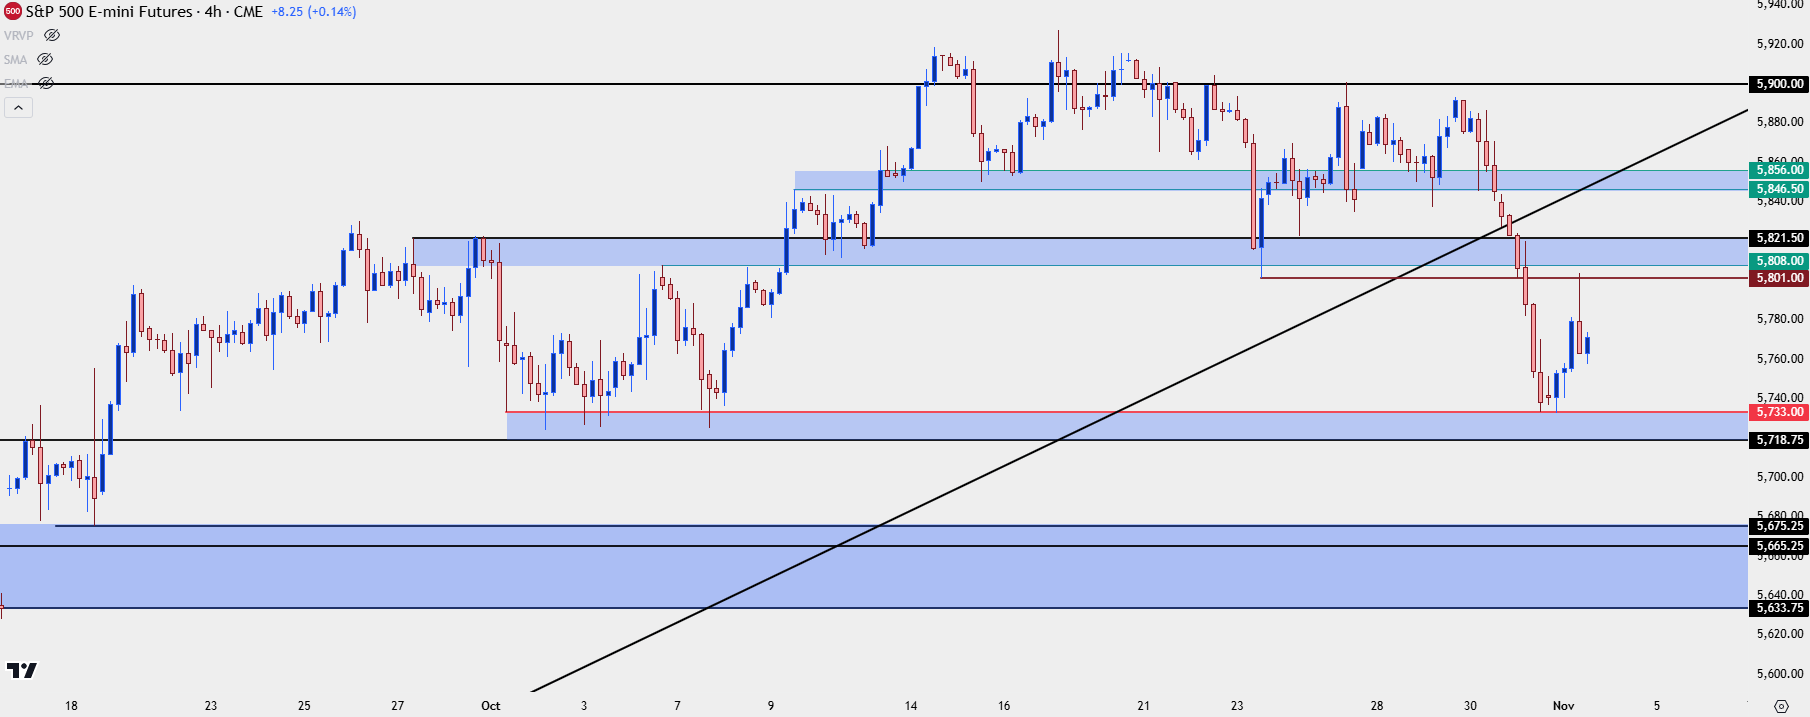
The challenge at this point for ES is a lack of acceptance above the 5,900 level, which has been tested quite a bit but to date, there’s been a failure from bulls to push topside trend above that price. Of course, looking above that looms the 6k level, which is a major psychological level, so that’s likely playing a role, to some degree.
S&P 500 Futures Four-Hour Chart
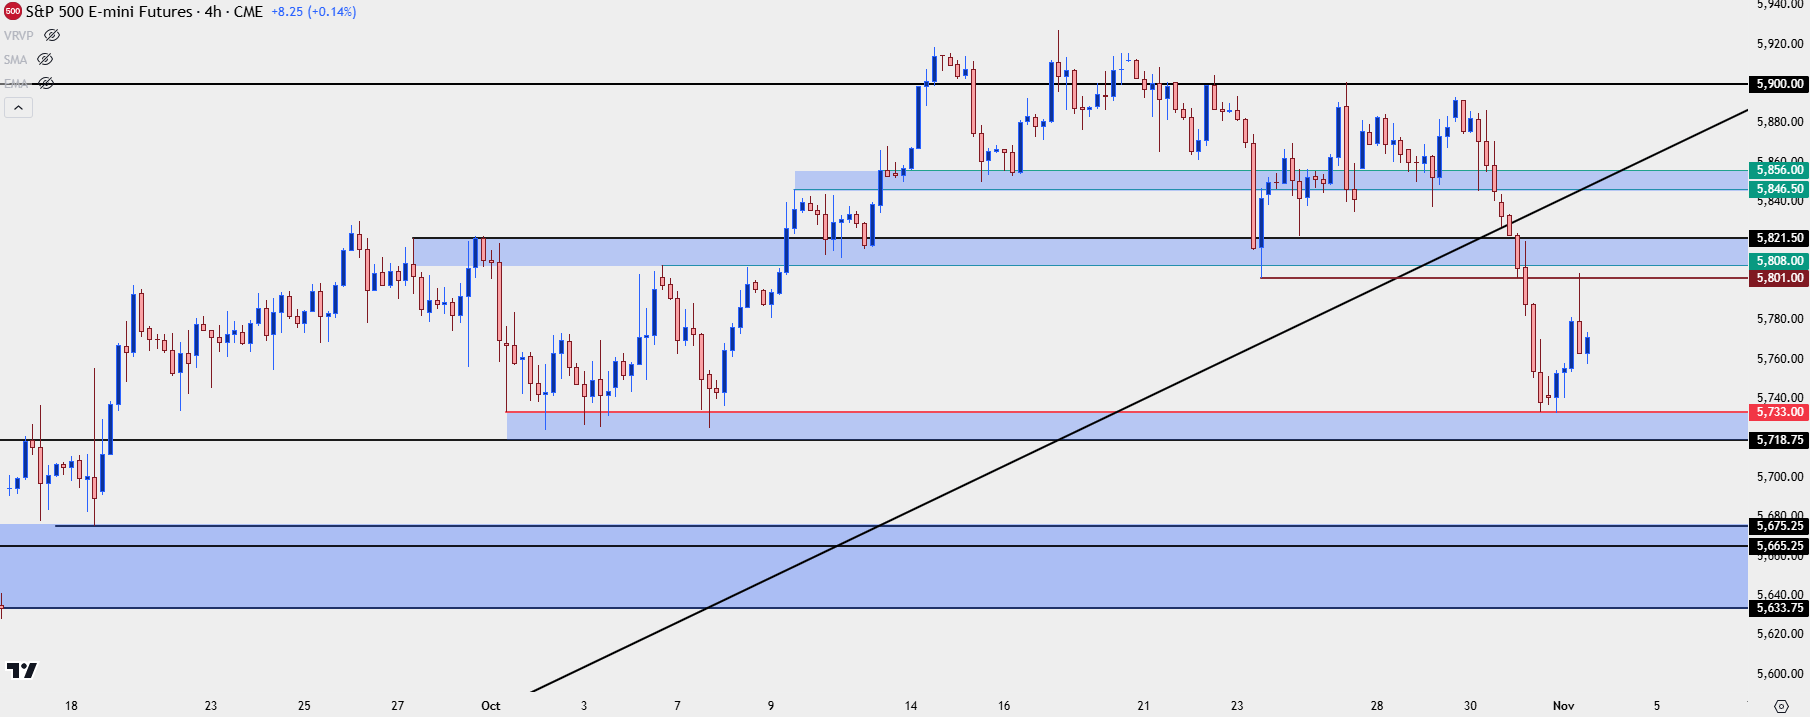 Chart prepared by James Stanley; data derived from Tradingview
There are a few different factors of concern, however, and this isn’t necessarily something that’s been reflected in price. US Treasury yields have continued to jump higher, and on Friday, the 10-year crossed the critical 4.34% level which has had a bit of drama over the past couple years. That was the high yield on the 10-year back in 2022, right around when stocks bottomed; and when that level was crossed in 2023, US equities took a major turn for the worse before ultimately bottoming right around when the 10-year began pulling back from the 5% level.
10 Year US Treasury Notes – Massive Move Since the FOMC Rate Cut
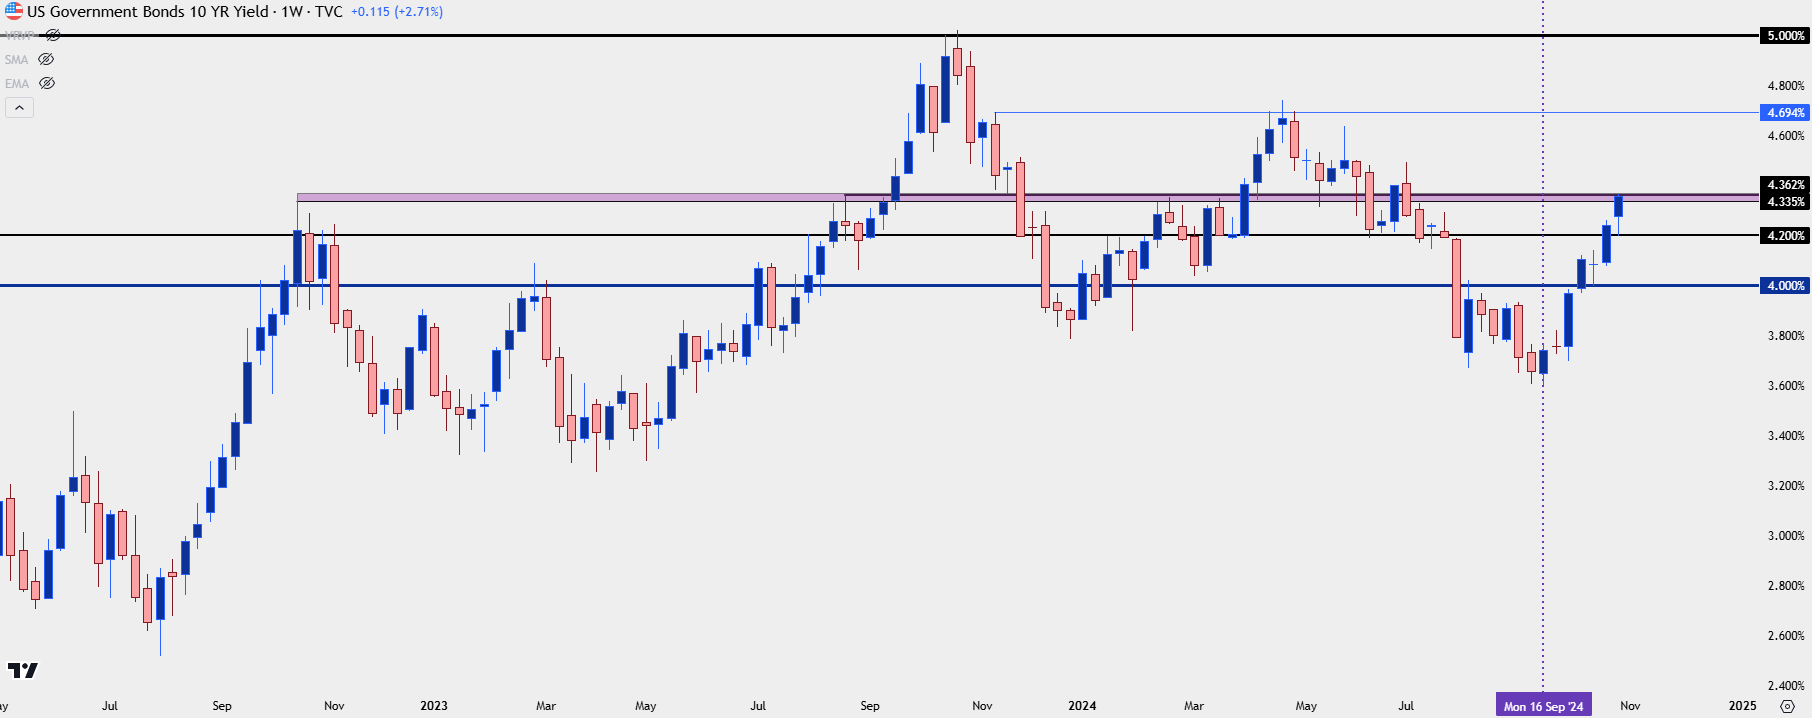 Chart prepared by James Stanley; data derived from Tradingview
Stock and Bond Relationships
Normally there’s an element of relationship between stock and bond markets. It’s not perfect by any stretch, especially on a shorter-term basis; but over the past couple years we can see these dynamics playing out.
As a case in point, the spike in 2022 that held 10-year yields at the high of 4.34% came right around the time that S&P 500 futures had bottomed and began to jump-higher into the end of that year.
And then last year, when the 10-year climbed above that same 4.34%, equities started to sell-off aggressively, and that largely remained all the way until after the 10-year had touched 5%, albeit briefly. As yields softened, stocks came back to life, and that rally lasted into the end of the year.
More recently, it’s only over the past couple weeks that we’ve seen that inverse relationship playing out, with stocks starting to pullback as 10-year yields have continued to push-higher.
On the below chart, I’m showing 10-year yields with the red line, and S&P 500 futures with the black line.
10-Year US Treasury Yields and S&P 500 Futures
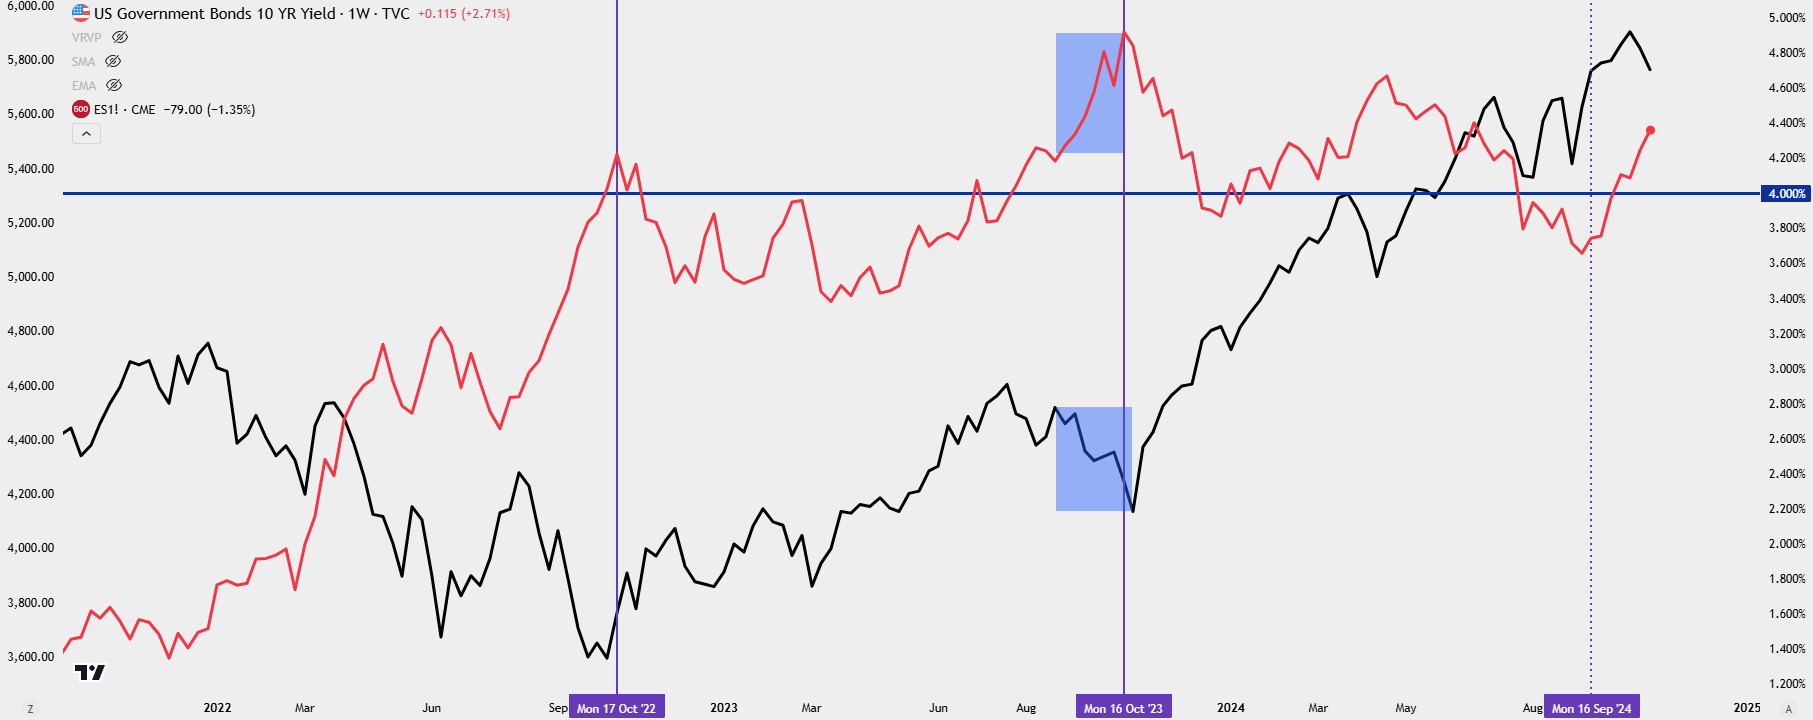 Chart prepared by James Stanley; data derived from Tradingview
Equity Pullback Potential
If we do see this run-higher in yields continue, it could eventually bring a larger impact to stocks. I think it would be far too early to dismiss that scenario given recent dynamics. But at this point we have to admit what this is which is only a mild pullback, all factors considered.
This speaks to what I had shared in the Q4 Forecast on stocks, in which the concerted bullish bias that’s been in-play for the 15 years since the Financial Collapse, and to a greater degree over the past two years since the inflation scenario in the US, there’s remained a strong bullish drive to US stocks.
To be sure, equities are elevated from several valuation metrics but with longer-term yields remaining relatively low (on a historical basis, at least), there’s been continued drive into higher-beta names, helping to buoy the equity market while pushing what’s been a continually bullish trend. This is likely why we’ve seen unsettling in stocks over the past couple of years as yields have spiked.
Perhaps that changes, but at this point, I don’t have evidence to suggest as such. Instead, just as I wrote in the forecast, I want to look for pullbacks for bullish trend continuation until something shifts or changes.
I had a similar outlay in each quarter this year: In Q2 that pullback showed up right at the quarterly open, and lasted for about three weeks. In Q3, that pullback showed in the middle of the quarter, and lasted for a few weeks before bulls ultimately pushed indices to fresh highs.
And now, with yields running, we may be on the verge of one of those scenarios.
At this point, the support that I wrote about last week has so far held the lows and there was an attractive bounce pushing from 5733 initially, until the 5800 level came into play as resistance.
A bit-lower is another zone of interest if we do see the pullback spread, and that’s taken from the contract gap that showed in September, just ahead of the FOMC rate cut. I wrote about that at the time and so far, it hasn’t been tested. But the contract gap from June had showed support on a couple of different occasions before buyers ultimately took control and that’s a scenario that remains in-play in the next couple of weeks ahead. That zone plots from 5633-5675.
For bullish trends, a push back above 5800 can start to open the door for such as that remains a point of support-turned-resistance and, at this point, it’s a lower-high.
S&P 500 Daily Price Chart
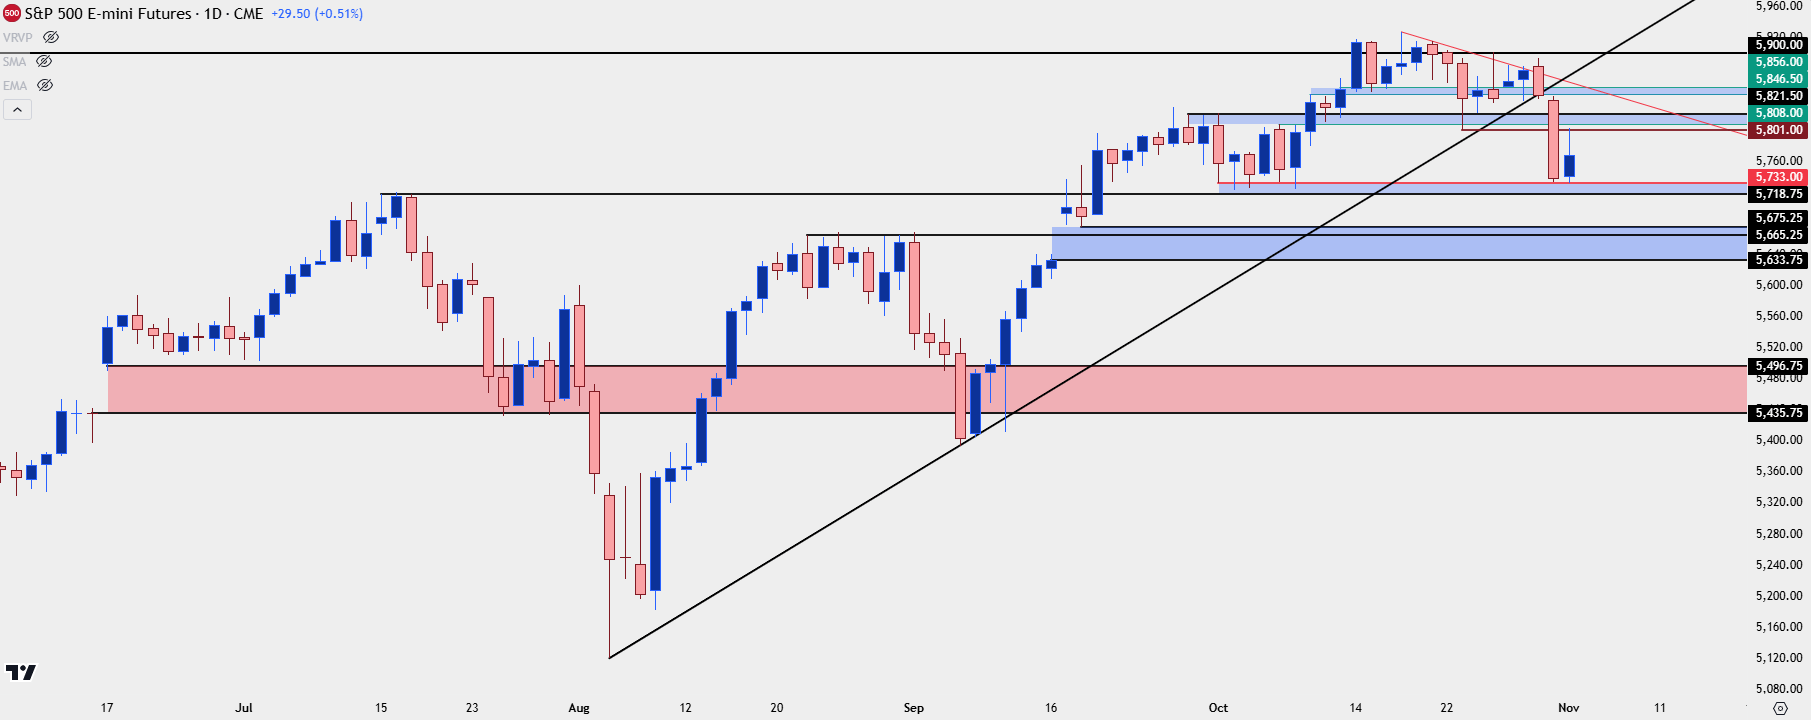 Chart prepared by James Stanley; data derived from Tradingview
--- written by James Stanley, Senior Strategist
S&P 500 Talking Points:
- The S&P 500 has been close to flat since the Q4 open, but it has held on to the bounce that showed after the September rate cut from the FOMC.
- As I wrote in the Q4 Forecast, pullbacks can remain attractive for positioning into US equities and this week showed two reactions to support that couldn’t continue into fresh trends. So swings have remained in-play but bulls haven’t yet appeared ready to drive fresh topside trends.
- To access that forecast in its entirety, the link below can set that up:
US Treasury Yields continued to push higher this week but at this point, stocks haven’t seemed too perturbed by that. We are seeing a second consecutive red week for S&P 500 futures but the sell-off thus far has been fairly controlled, with bounces showing at support.
The challenge at this point for ES is a lack of acceptance above the 5,900 level, which has been tested quite a bit but to date, there’s been a failure from bulls to push topside trend above that price. Of course, looking above that looms the 6k level, which is a major psychological level, so that’s likely playing a role, to some degree.
S&P 500 Futures Four-Hour Chart
There are a few different factors of concern, however, and this isn’t necessarily something that’s been reflected in price. US Treasury yields have continued to jump higher, and on Friday, the 10-year crossed the critical 4.34% level which has had a bit of drama over the past couple years. That was the high yield on the 10-year back in 2022, right around when stocks bottomed; and when that level was crossed in 2023, US equities took a major turn for the worse before ultimately bottoming right around when the 10-year began pulling back from the 5% level.
10 Year US Treasury Notes – Massive Move Since the FOMC Rate Cut
Stock and Bond Relationships
Normally there’s an element of relationship between stock and bond markets. It’s not perfect by any stretch, especially on a shorter-term basis; but over the past couple years we can see these dynamics playing out.
As a case in point, the spike in 2022 that held 10-year yields at the high of 4.34% came right around the time that S&P 500 futures had bottomed and began to jump-higher into the end of that year.
And then last year, when the 10-year climbed above that same 4.34%, equities started to sell-off aggressively, and that largely remained all the way until after the 10-year had touched 5%, albeit briefly. As yields softened, stocks came back to life, and that rally lasted into the end of the year.
More recently, it’s only over the past couple weeks that we’ve seen that inverse relationship playing out, with stocks starting to pullback as 10-year yields have continued to push-higher.
On the below chart, I’m showing 10-year yields with the red line, and S&P 500 futures with the black line.
10-Year US Treasury Yields and S&P 500 Futures
Equity Pullback Potential
If we do see this run-higher in yields continue, it could eventually bring a larger impact to stocks. I think it would be far too early to dismiss that scenario given recent dynamics. But at this point we have to admit what this is which is only a mild pullback, all factors considered.
This speaks to what I had shared in the Q4 Forecast on stocks, in which the concerted bullish bias that’s been in-play for the 15 years since the Financial Collapse, and to a greater degree over the past two years since the inflation scenario in the US, there’s remained a strong bullish drive to US stocks.
To be sure, equities are elevated from several valuation metrics but with longer-term yields remaining relatively low (on a historical basis, at least), there’s been continued drive into higher-beta names, helping to buoy the equity market while pushing what’s been a continually bullish trend. This is likely why we’ve seen unsettling in stocks over the past couple of years as yields have spiked.
Perhaps that changes, but at this point, I don’t have evidence to suggest as such. Instead, just as I wrote in the forecast, I want to look for pullbacks for bullish trend continuation until something shifts or changes.
I had a similar outlay in each quarter this year: In Q2 that pullback showed up right at the quarterly open, and lasted for about three weeks. In Q3, that pullback showed in the middle of the quarter, and lasted for a few weeks before bulls ultimately pushed indices to fresh highs.
And now, with yields running, we may be on the verge of one of those scenarios.
At this point, the support that I wrote about last week has so far held the lows and there was an attractive bounce pushing from 5733 initially, until the 5800 level came into play as resistance.
A bit-lower is another zone of interest if we do see the pullback spread, and that’s taken from the contract gap that showed in September, just ahead of the FOMC rate cut. I wrote about that at the time and so far, it hasn’t been tested. But the contract gap from June had showed support on a couple of different occasions before buyers ultimately took control and that’s a scenario that remains in-play in the next couple of weeks ahead. That zone plots from 5633-5675.
For bullish trends, a push back above 5800 can start to open the door for such as that remains a point of support-turned-resistance and, at this point, it’s a lower-high.
S&P 500 Daily Price Chart
--- written by James Stanley, Senior Strategist



The complete CFD trading experience
Award-winning platforms, competitive spreads, low commissions and dedicated support.
We live and breathe the markets and are dedicated to helping traders realise their ambitions as we continue to set the industry bar.
Economic calendar
Web Trader platform
Our sophisticated web-based platform is packed with features.
Related articles
Gold forecast: Can XAU/USD hold $4000 support?
Gold has started the week trying to stabilise around the $4,000 level after last week’s 4% drop that saw the metal briefly drop and close below this psychological hurdle.

Brazil Elections: Is Investor Confidence Beginning to Fade?
One of the most relevant events for emerging markets in recent sessions has been the outcome of Brazil’s presidential election. Following Lula da Silva’s victory in the second round, investor sentiment began to deteriorate noticeably. This can be observed in both the iShares MSCI Brazil ETF and the VanEck Brazil Small-Cap ETF, two important benchmarks for tracking the Brazilian equity market, both of which have posted declines of more than 15% at the start of the week.


USD/JPY bulls back in business as AI trade roars back
The AI investment boom rolls on, with Anthropic and Meta helping revive enthusiasm across Wall Street. USD/JPY has responded with a bullish reversal pattern, putting its former trading range back in focus ahead of major central bank decisions and technology earnings.

StoneX Europe Ltd may make third party material available on this website which may contain information included but not limited to the conditions of financial markets. The material is for information purposes only and does not contain, and should not be construed as containing, investment advice and/or investment recommendation and/or an investment research and/or an offer of or solicitation for any transactions in financial instruments; any decision to enter into a specific transaction shall be made by the client following an assessment by him/her of their situation.
StoneX Europe Ltd makes no representation or warranty and assumes no liability as to the accuracy or completeness of the information provided, nor any loss arising from any investment based on a recommendation, forecast or other information supplied. You should always seek independent advice as to your suitability to speculate in any related markets and your ability to assume the associated risks, if you are at all unsure. We are not under any obligation to update any such material. Any opinion made may be personal to the author and may not reflect the opinion of StoneX Europe Ltd.