



USD into PCE: Gold, BTC, USD/JPY, EUR/USD, GBP/USD
The US Dollar has extended a series of lower-lows and highs and tomorrow brings the Fed’s preferred inflation gauge of Core PCE. It still feels to be a USD/JPY market, but larger bullish themes have built in gold and BTC as a world fueled by debt doesn’t look to soon be turning towards austerity or fiscal prudence.
Share this:

US Dollar Talking Points:
- The massive USD/JPY carry trade continues to drive larger USD flows even in pairs like EUR/USD and GBP/USD, putting even more emphasis on tomorrow’s Core PCE report.
- The expectation is for inflation to match last month’s 3.3% print, with lower-than-expected bringing the prospect of USD/JPY pullbacks and diminished expectations for 2026 rate hikes.
We’re in an environment where one should expect curveballs. Last week’s announcement of larger Treasury buybacks proves that point and that follows the dual intervention in the Japanese Yen. The one thing that is certain is that austerity and slower spending doesn’t seem to be on the cards for the US and with a maturity wall of Treasury debt coming due, US Treasury Secretary Scott Bessent has his work cut out for him, which is probably why we’ve been hearing so much of late.
But, for tomorrow, the focus is back on data and from this, we can further build out rate expectations which still harbor a strong probability of a rate hike from the Fed by the end of the year, to the tune of approximately 73% as of this writing and as of this webinar.
That’s a lot of room for volatility particularly if we do see slower inflation price those odds down, which could hit the USD given how heavily influenced Dollar price action has been by the still crowded USD/JPY trade.
Core PCE Releases Since Jan 2021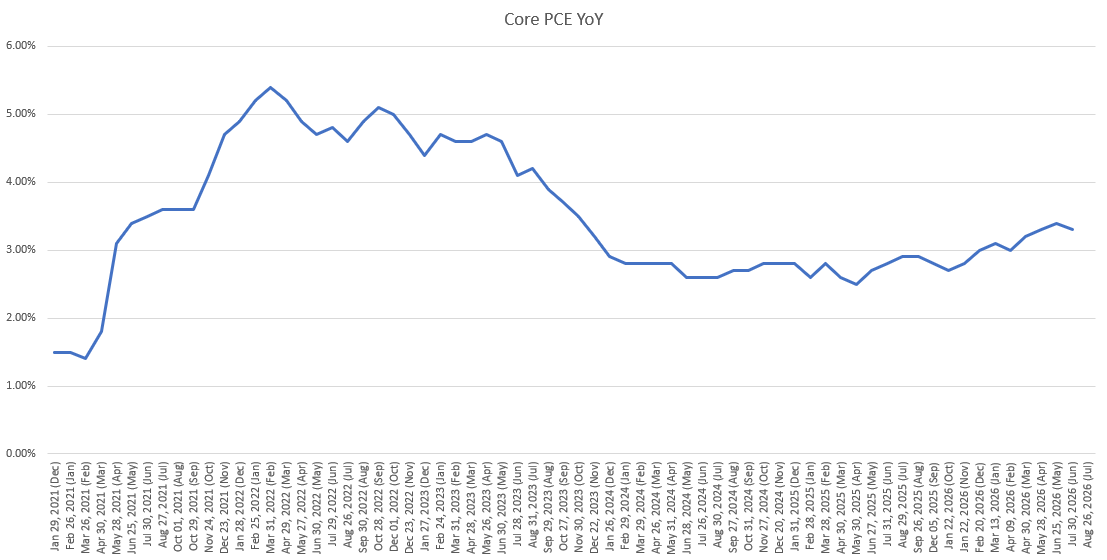
Chart prepared by James Stanley; data derived from Tradingview
What Makes Core PCE So Important?
While Core CPI remains close to the Fed’s target with last month’s 2.5% print, Core PCE which is often called the Fed’s preferred inflation gauge, paints a different picture and this flared up to 3.4% with the release in June. This illustrates the seeping in of inflation from higher energy prices and this is what really has policymakers concerned given the continued vulnerability around oil prices from the ongoing conflict in Iran. While Core inflation metrics strip out food and energy, there’s still a flow-through effect of how higher transportation costs can affect products that aren’t directly food or energy, and that’s what Core PCE illustrated more than Core CPI.
Core PCE was at 2.7% in last October’s release and rate cuts from the Fed helped to push that back over 3% with the data point continuing to rise in the first-half of the year.
Tomorrow we get the next iteration and this will have a pull on rate expectations which are still quite elevated with a 72.7% probability of at least one 25 bp hike by the end of this year.
CME Fedwatch Rate Probabilities into End of 2026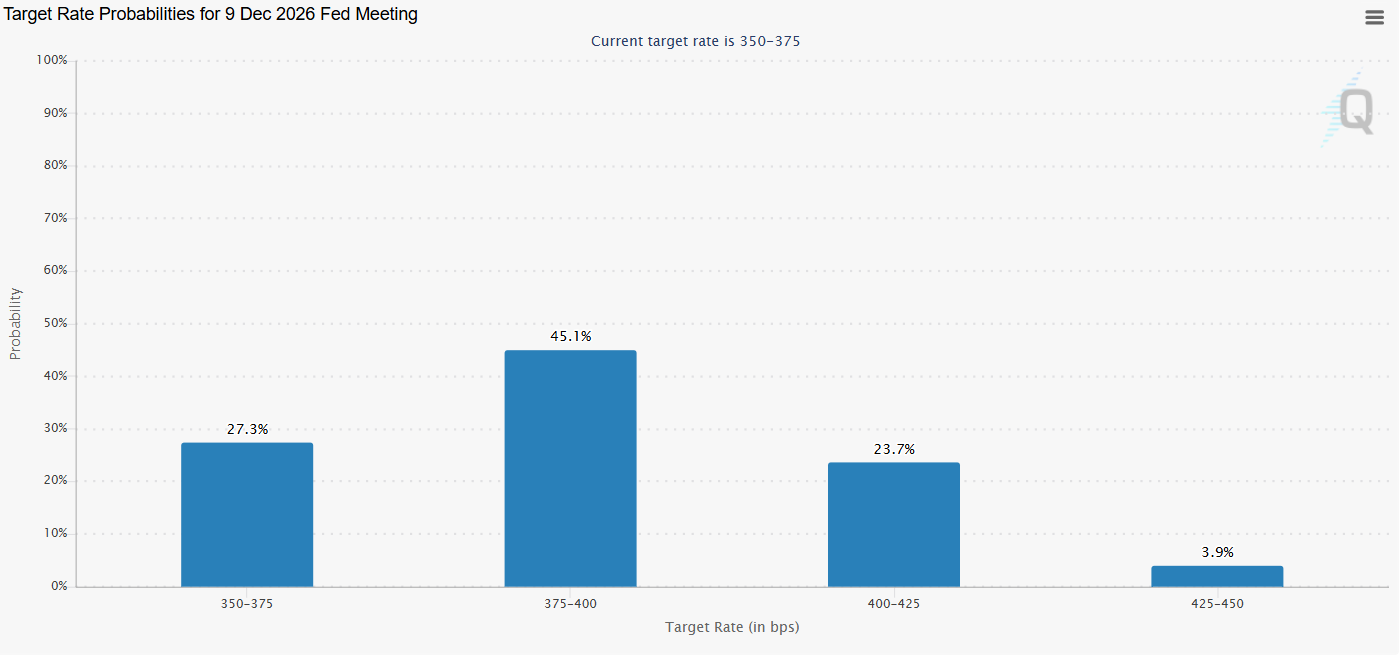
Chart prepared by James Stanley; data derived from Tradingview
USD
Given the widespread expectation for a rate hike this would imply that lower expectations of rate hikes could compel USD-weakness. And price action can justify that at this point given last week’s push to a lower-low.
But perhaps more important than just theoretical fundamental tie-ins is the actual effect of the USD basket’s composition. USD/JPY remains in a peculiar spot after the dual intervention in late-July where there’s a perceived cap for upside run, even with the carry and the fundamental backdrop remaining decisively tilted towards the long side of the pair.
But as we’ve seen soft(er) US data, there’s been stronger pullbacks in USD/JPY and that’s been bearish price action in DXY.
That bearish move got another shot last week on the Treasury buyback announcement and that has since stalled, which keeps the door open for short-term strength. The complication with extrapolating that into anything intermediate or longer-term is the likely necessity of USD/JPY putting in a breakout at or beyond 160.00 which then bears the question as to whether policymakers, either the BoJ or Scott Bessent, will respond or risk looking weak in front of market participants.
US Dollar Four-Hour Price Chart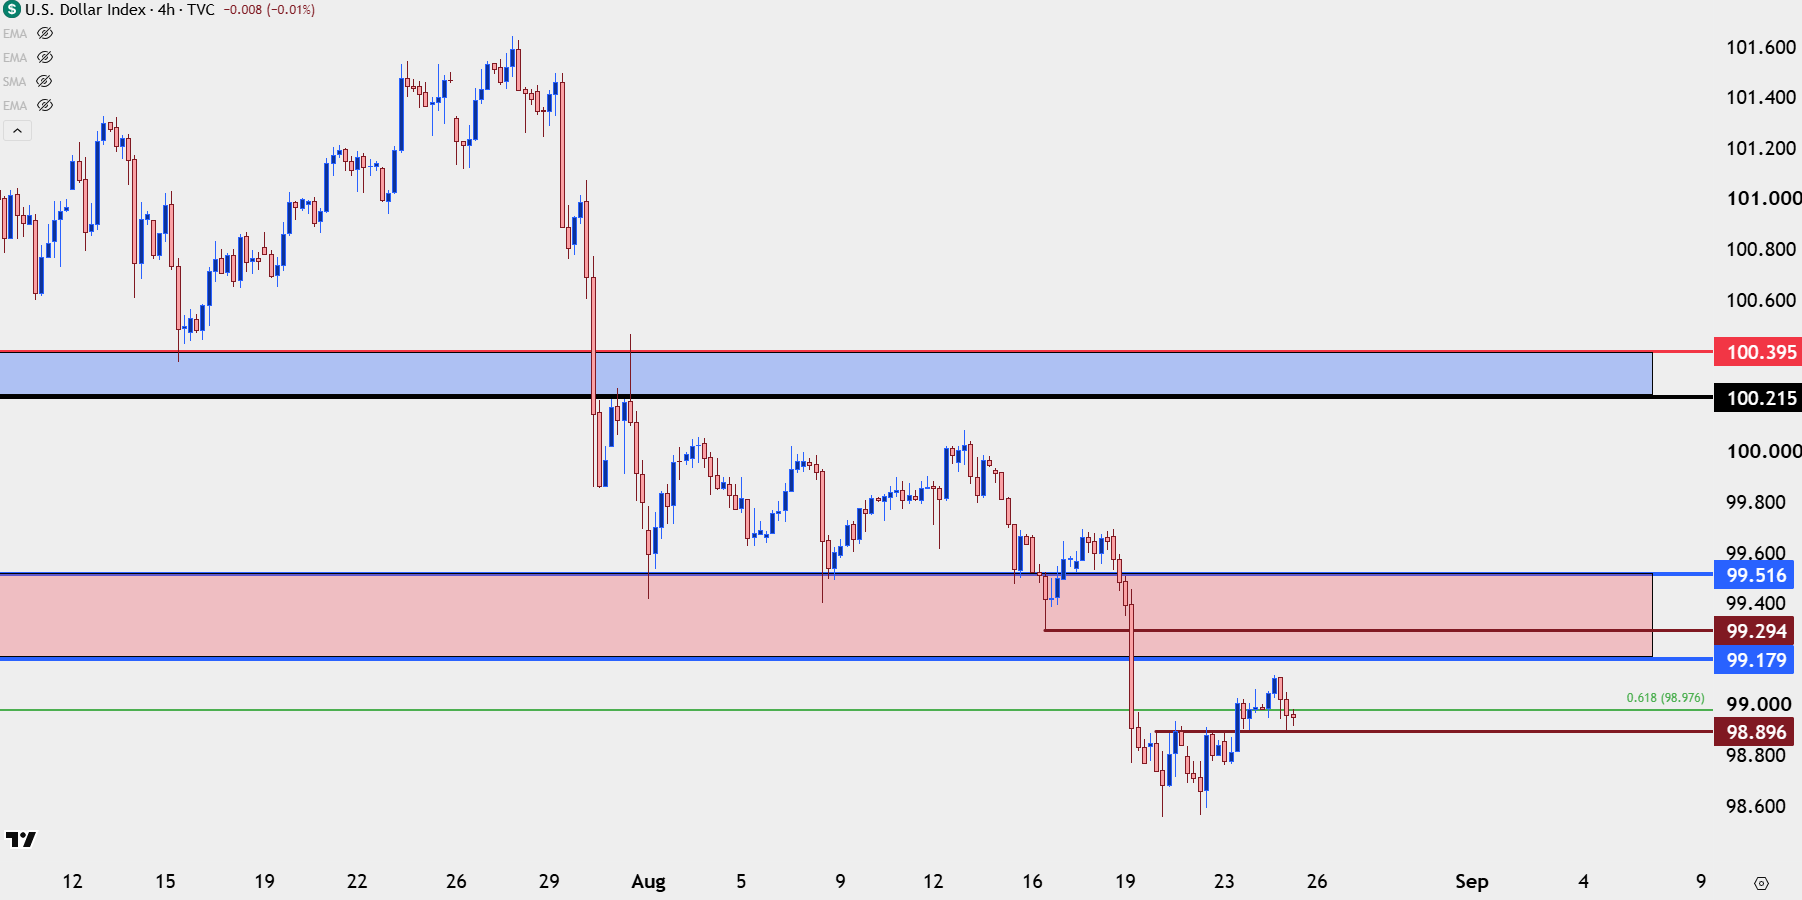
Chart prepared by James Stanley; data derived from Tradingview
USD/JPY
From purely a chart perspective USD/JPY looks like a market that wants to test higher-highs. Of course, there’s a reason that this hasn’t yet, as there’s the fear of another swing of intervention, which could run stops and possibly even create gaps on the way down.
But, so far this has remained a compelling setup for pullbacks, as we’ve seen to reactions to weak NFP or CPI or PPI or even last week’s Treasury buyback announcement.
For tomorrow, if PCE comes out soft the door opens for another pullback, and there’s support structure at 158.58, 157.78-158.09 and then 157.30.
If Core PCE surprises significantly to the downside, we could see a larger knee jerk reaction as this remains a heavily crowded long trade and it’s those expectations for Fed hikes that’s kept bulls bidding dips. If the inflation data changes, so too could the bullish response.
USD/JPY Daily Price Chart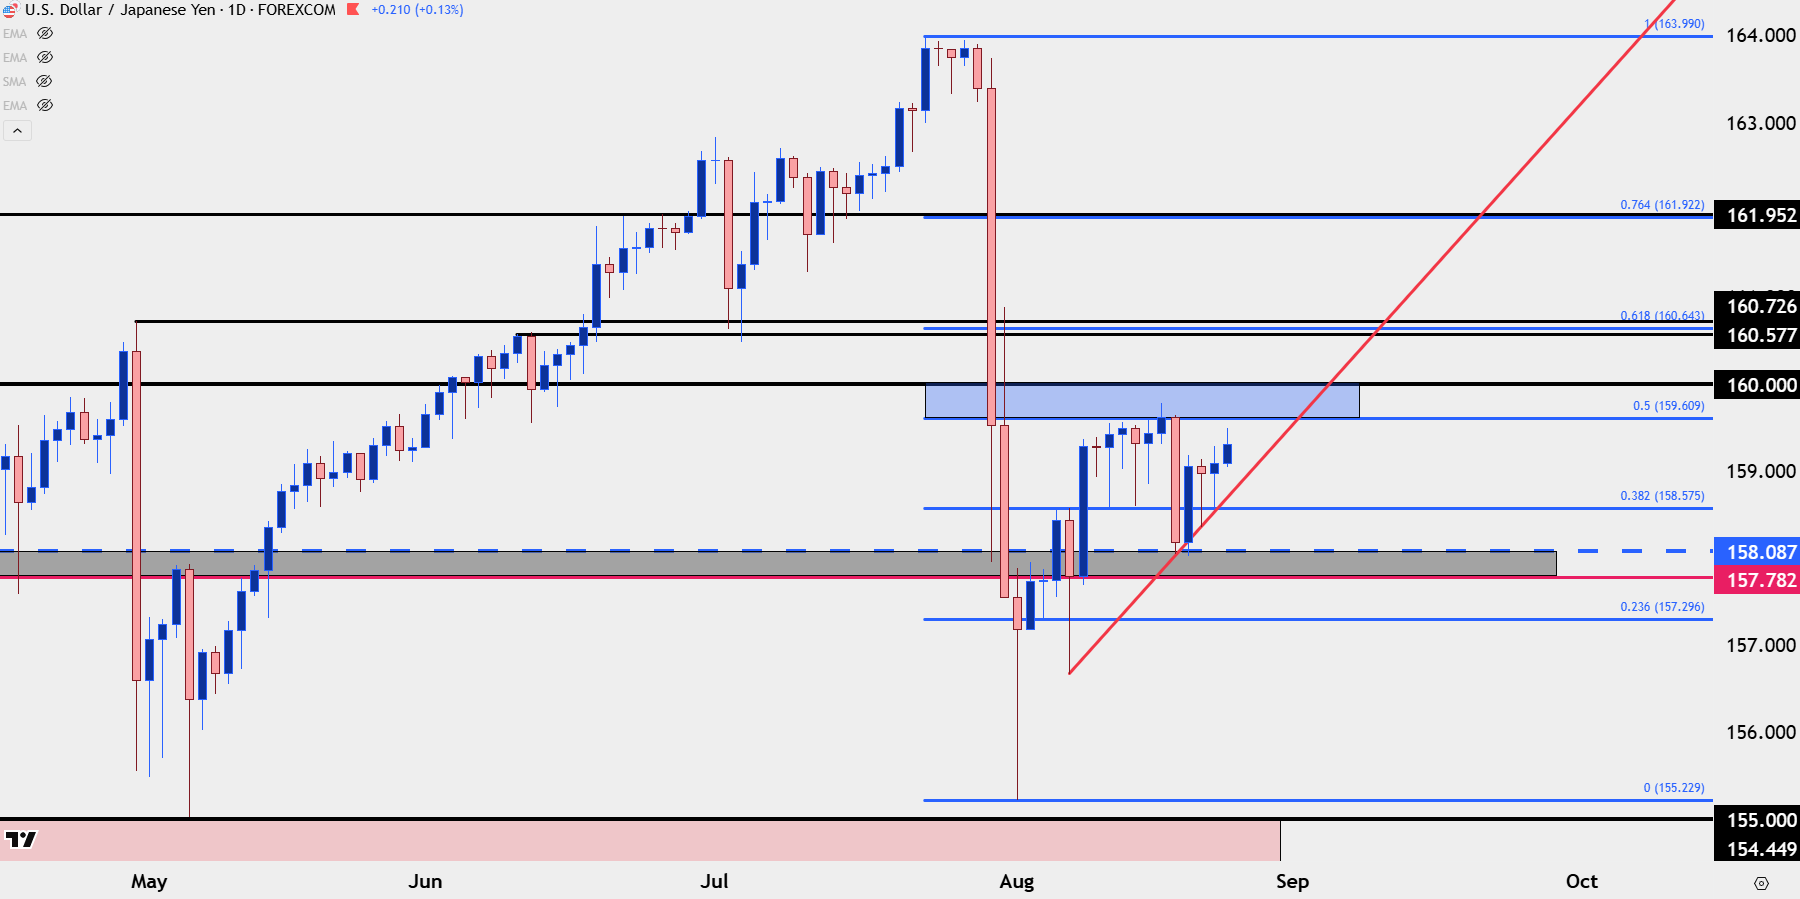
Chart prepared by James Stanley; data derived from Tradingview
Gold
I still consider gold as attractive because if we reduce to lowest common denominators, the most unlikely path seems to be one of fiscal prudence and austerity, and this isn’t just a US problem as a debt-fueled world continues to avoid the tough medicine of balanced budgets.
This is why gold initially left the $2k level behind back in 2024 when the Fed pushed for rate cuts even without inflation below their inflation target. And in total, there’s been a total of 175 basis points of softening and not once has Core PCE printed inside of 2%.
Warsh talking tough on inflation but avoiding hikes in July is what helped to spur the gold breakout from the falling wedge. And then last week’s Treasury buyback announcement gave gold prices another major shot in the arm.
At this point gold is overbought on the daily, making for a difficult case to chase. But – if there is strong inflation in tomorrow’s report there’s an opening door for a pullback and I have a few zones of interest for that on the below daily chart.
Gold Daily Chart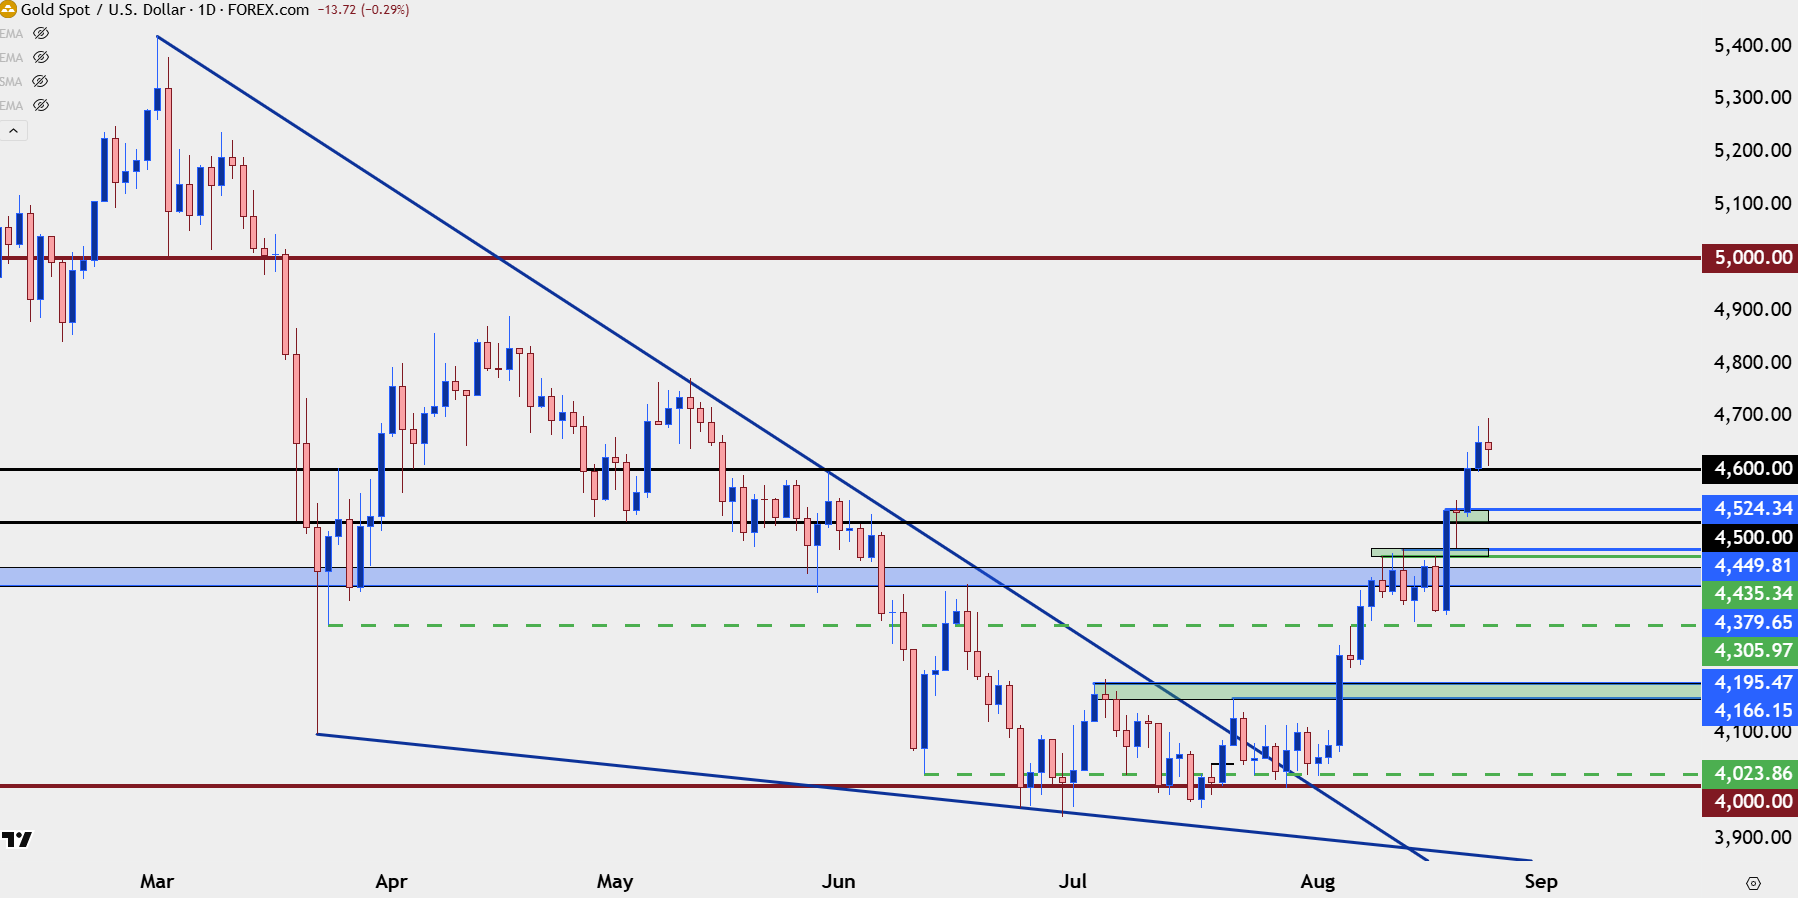
Chart prepared by James Stanley; data derived from Tradingview
Bitcoin
In the webinar I explained and showed why I think much of this move in Bitcoin is driven by a short squeeze. But – short squeezes can turn into legit rallies, they just need to see buyer participation on pullbacks to higher-lows. That’s the part that hasn’t played yet despite the impressive breakout and re-test of the 80k handle.
BTC/USD Daily Price Chart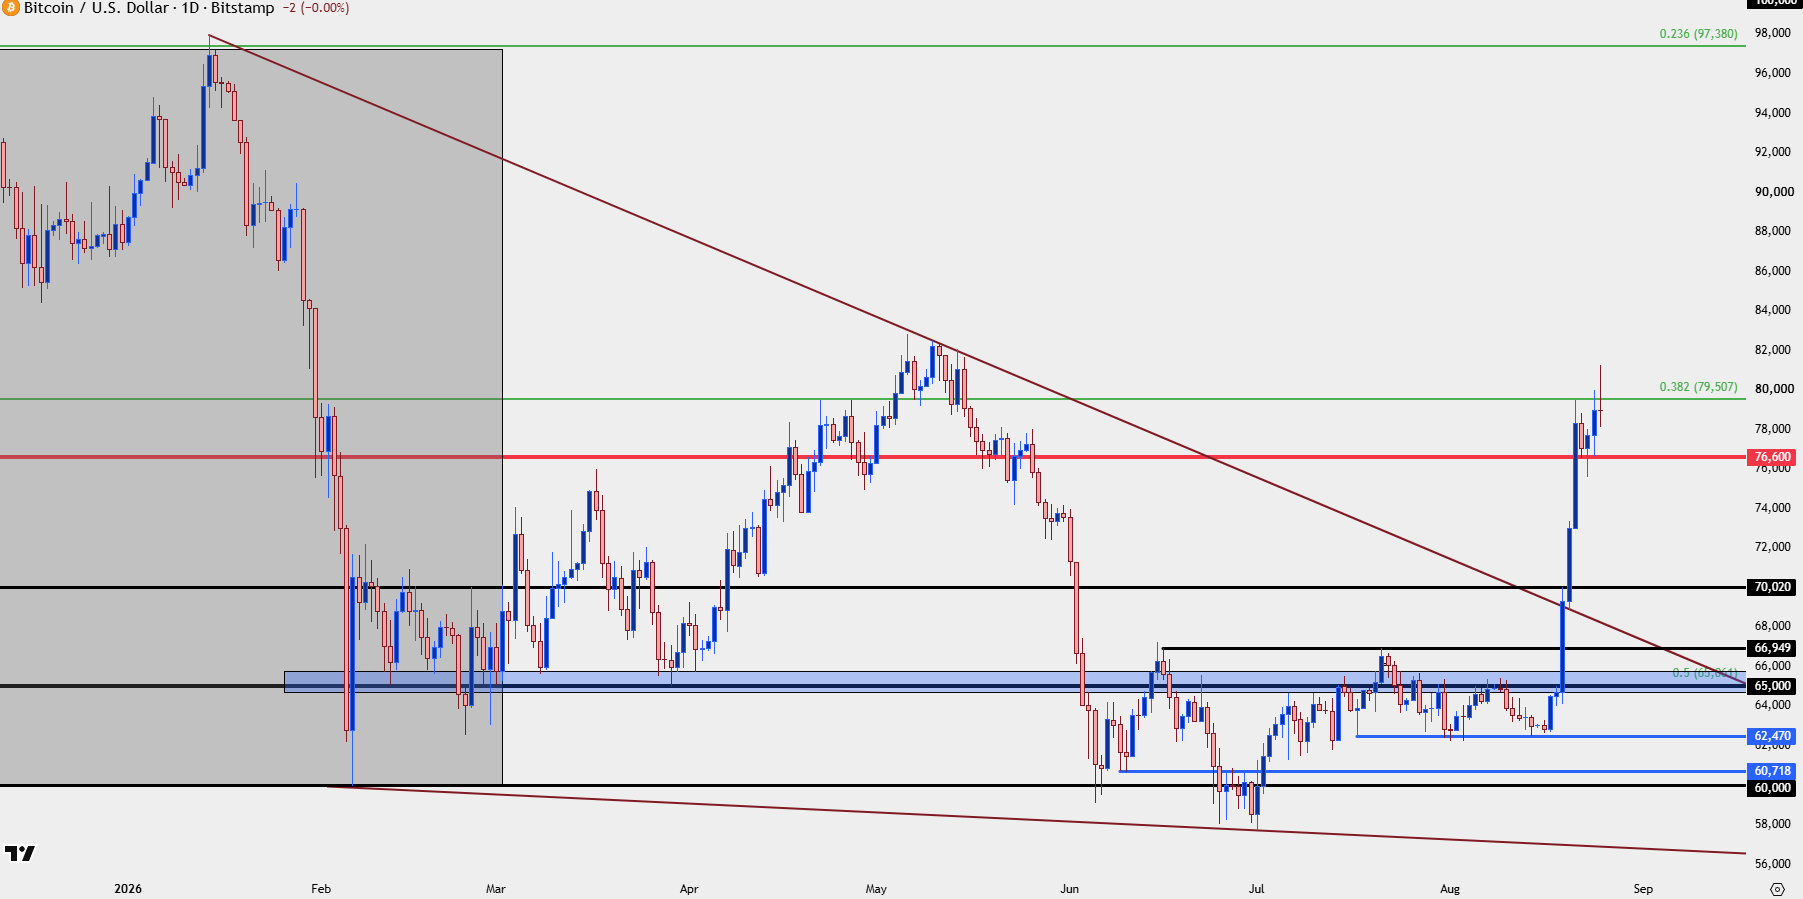
Chart prepared by James Stanley; data derived from Tradingview
EUR/USD
Despite the fireworks showing elsewhere EUR/USD has been rather clean, all factors considered. Like the two days of stalling in the DXY sell-off, EUR/USD’s rally saw two consecutive days of indecision following the Treasury buyback-fueled breakout.
The pair still feels a bit heavy to me, so where I like this is USD-strength scenarios after Core PCE, with USD/JPY testing a breakout of 159.60 and perhaps even 160.00 allowing for pullback in EUR/USD to test the 1.1576-1.1613 zone which tested well on the way up but, as yet, hasn’t shown much for support.
EUR/USD Daily Price Chart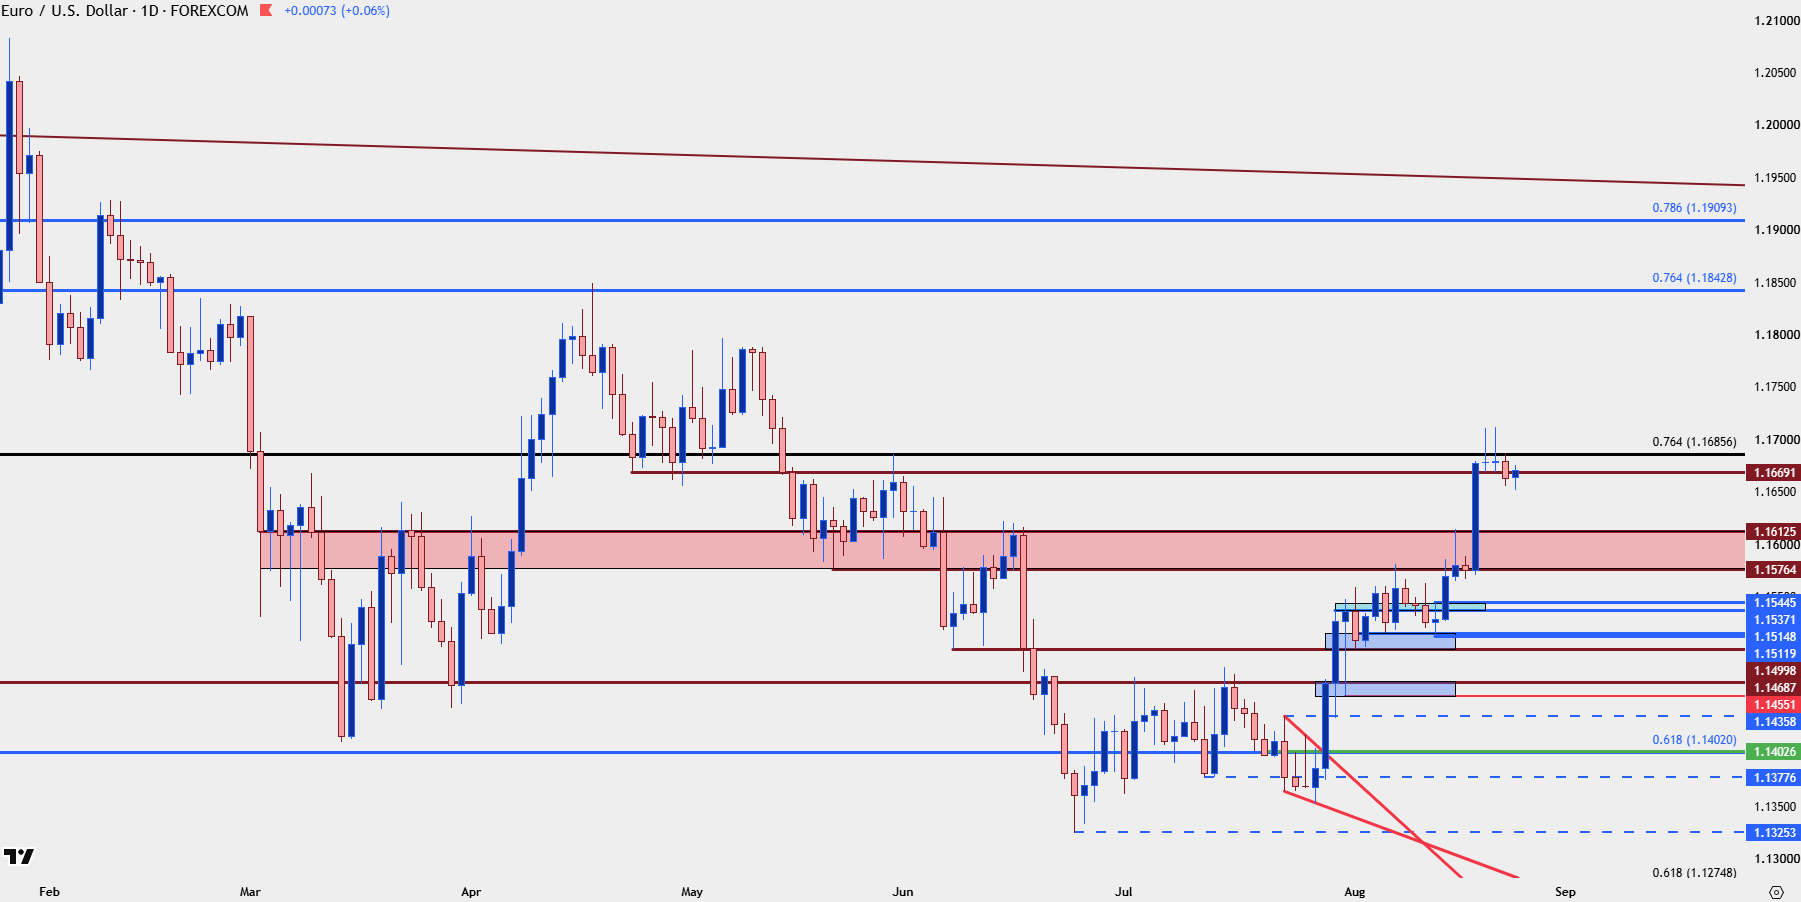
Chart prepared by James Stanley; data derived from Tradingview
GBP/USD
For shorter-term or more near-term strategies of USD-weakness, I prefer Cable at this point. The pair has held flat support well on the four-hour chart and there can even be a bull pennant argued. There’s a deeper spot of support around the 1.3600 handle and another around 1.3558, but comparatively there’s been additional GBP-strength versus the US Dollar that doesn’t quite show as well in EUR/USD.
GBP/USD Four-Hour Price Chart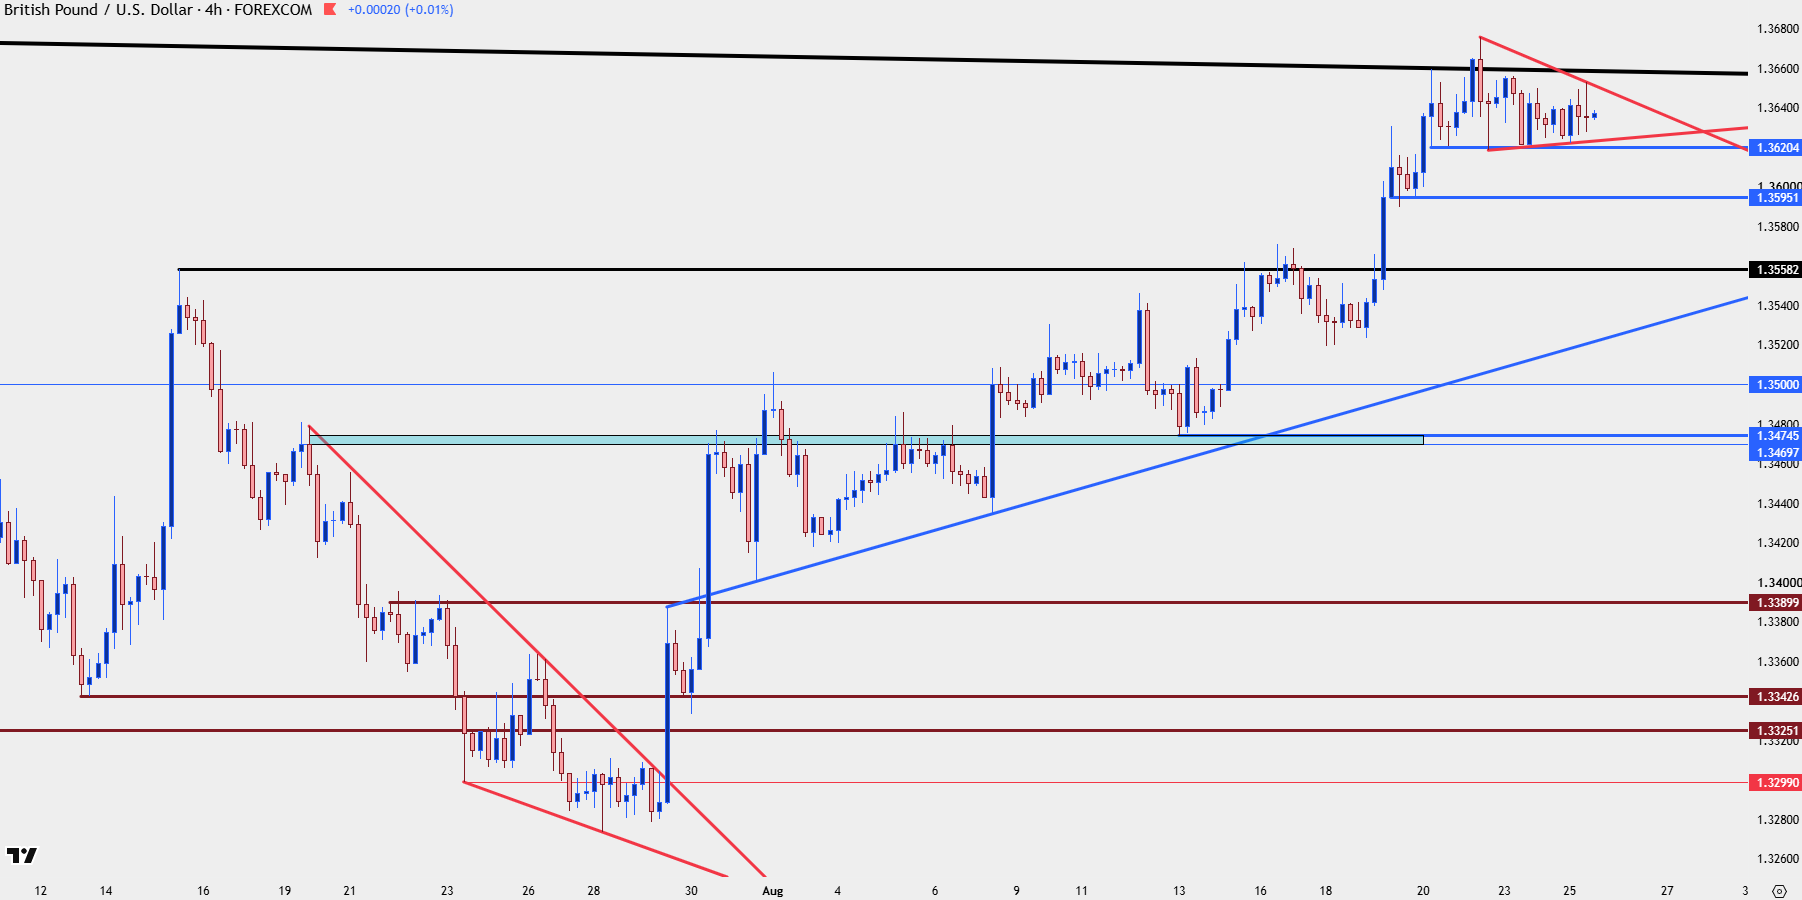
Chart prepared by James Stanley; data derived from Tradingview
--- written by James Stanley, Senior Market Analyst, Global Macro
Latest market news




The complete CFD trading experience
Award-winning platforms, competitive spreads, low commissions and dedicated support.
We live and breathe the markets and are dedicated to helping traders realise their ambitions as we continue to set the industry bar.
Economic calendar
Web Trader platform
Our sophisticated web-based platform is packed with features.
Related articles
S&P 500, Nasdaq, Dow and Russell 2000 For the Week Ahead
Stocks started to shake last week and there was even a hint of this in the prior week. The question now is whether we’re at the point where buyers may abandon pullbacks as get closer to mid-term elections.
Euro Technical Forecast: EUR/USD Snaps Five-Week Slide at Critical Support 10 17 2026
Euro is attempting to regain its footing as stretched momentum raises the stakes for the next move ahead of key PMI data and central bank decisions.

Gold weekly outlook: XAU/USD remains stuck between a rock and a hard place
Gold remains at risk of staging a deeper correction. Though the dollar has eased back a bit along with yields, both still remain fundamentally supported.

StoneX Europe Ltd may make third party material available on this website which may contain information included but not limited to the conditions of financial markets. The material is for information purposes only and does not contain, and should not be construed as containing, investment advice and/or investment recommendation and/or an investment research and/or an offer of or solicitation for any transactions in financial instruments; any decision to enter into a specific transaction shall be made by the client following an assessment by him/her of their situation.
StoneX Europe Ltd makes no representation or warranty and assumes no liability as to the accuracy or completeness of the information provided, nor any loss arising from any investment based on a recommendation, forecast or other information supplied. You should always seek independent advice as to your suitability to speculate in any related markets and your ability to assume the associated risks, if you are at all unsure. We are not under any obligation to update any such material. Any opinion made may be personal to the author and may not reflect the opinion of StoneX Europe Ltd.