



USD Pre-NFP Price Action Setups: EUR/USD, GBP/USD, USD/JPY, USD/CAD
The USD started August on a sour note after the release of NFP data, but the past few weeks have seen support build in even with markets pricing in a slew of rate cuts into the end of this year and next.
Share this:

US Dollar Talking Points:
Well, it’s been a rather quiet past month for the US Dollar as we trade into the final month of Q3. While the month of July was strong as DXY showed its largest monthly gain since 2022, a strong sell-off on the first day of August sent the currency in retreat until support began to build just above 97.50, and for the past few weeks it’s been a lot of back-and-forth.
Expectations are high for the Fed to cut rates at their meeting in a couple of weeks with odds currently at just under 98% for a 25 bp cut. More questionable, however is what happens after that, which means that the Fed’s dot plot matrix may actually be a larger driver at that meeting than the interest rate cut itself.
While President Trump and US Treasury Secretary Scott Bessent have both alluded to this rate cut as being a starting point for many more cuts, and markets are currently pricing in that probability with another 100 bps of cuts expected by the end of next year, much of the Fed has sounded more cautious on the matter. And if we look at it from the perspective of the dual mandate that the Fed is charged to uphold, that makes sense, as inflation has been rising of late with Core CPI going back over 3% and Core PCE pushing up to 2.9%; both well above the Fed’s 2% target.
What has given fuel to to those rate cut expectations is the other side of the Fed’s mandate with the labor market, but even that remains a question mark. At the Fed’s last meeting in July, Jerome Powell said that it was the unemployment rate that the bank was watching as this smoothed out some nuances in the data that seemed volatile. He also said that given the unemployment rate holding near full employment levels, combined with rising inflation, it didn’t seem as though the Fed’s rate structure was overly restrictive. That’s what helped the USD to rally and finish July as its best month in three years.
And then a day later, the unemployment rate came in right at the expected 4.2%. What took a larger toll, however, was the massive revision to prior months’ headline numbers and that’s what created the outsized sell-off in the Greenback while pushing rate cut expectations higher.
And then at Jackson Hole, Powell sounded different than he did just a month earlier as he opened the door to rate cut potential at the bank’s next meeting in two weeks. This is what helped gold to breakout in such an aggressive fashion and that move in gold has continued to gain as markets are pricing in the possibility of the FOMC cutting rates even with elevated inflation.
Tomorrow is when we get the next significant piece of data for the labor market with the release of Non-farm Payrolls for the month of August. The expectation is for the unemployment rate to have risen to 4.3% from last month’s 4.2% print, and the headline number is expected at 75k versus last month’s 73k print. Of course, as we saw last month, the revision to prior months’ data can also take a toll here.
In the US Dollar, the big driver appears to be those future expectations as a rate cut is already well priced-in for the September meeting. There’s a whopping 90.2% probability for another 25 bp cut by the end of this year, and 42.5% probability for another two 25 bp cuts which would mean a cut at each remaining meeting for the rest of this year.
Target Rate Probabilities for FOMC into Year-End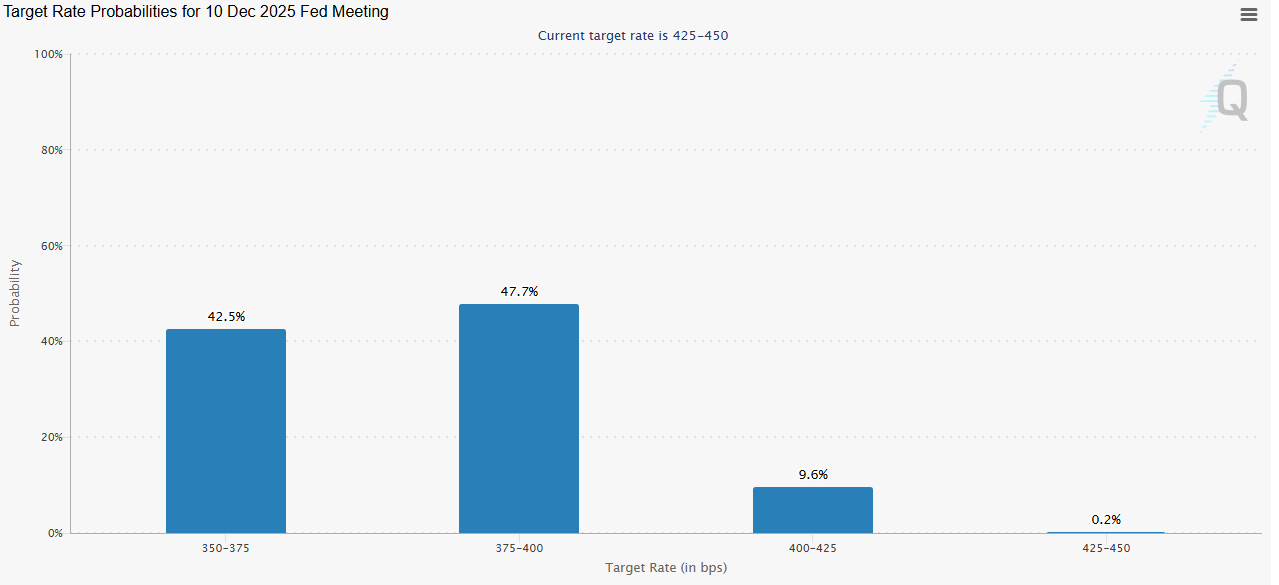
Taken from CME Fedwatch
From the weekly USD chart, we can see a stalled move following the decisive sell-off that took over in the first half of the year. Bulls haven’t exactly been able to run with matters as the upper wicks since the August open highlight continued failures from bulls to take control of the trend. It also draws a line in the sand at 98.98 given the lower-highs that have posted from those extended upper wicks, and if bulls can finally push a weekly close above that level it’ll start to look like a change in control.
Until then, the prospect of capitulation remains of interest as I had covered in this week’s webinar.
US Dollar Weekly Chart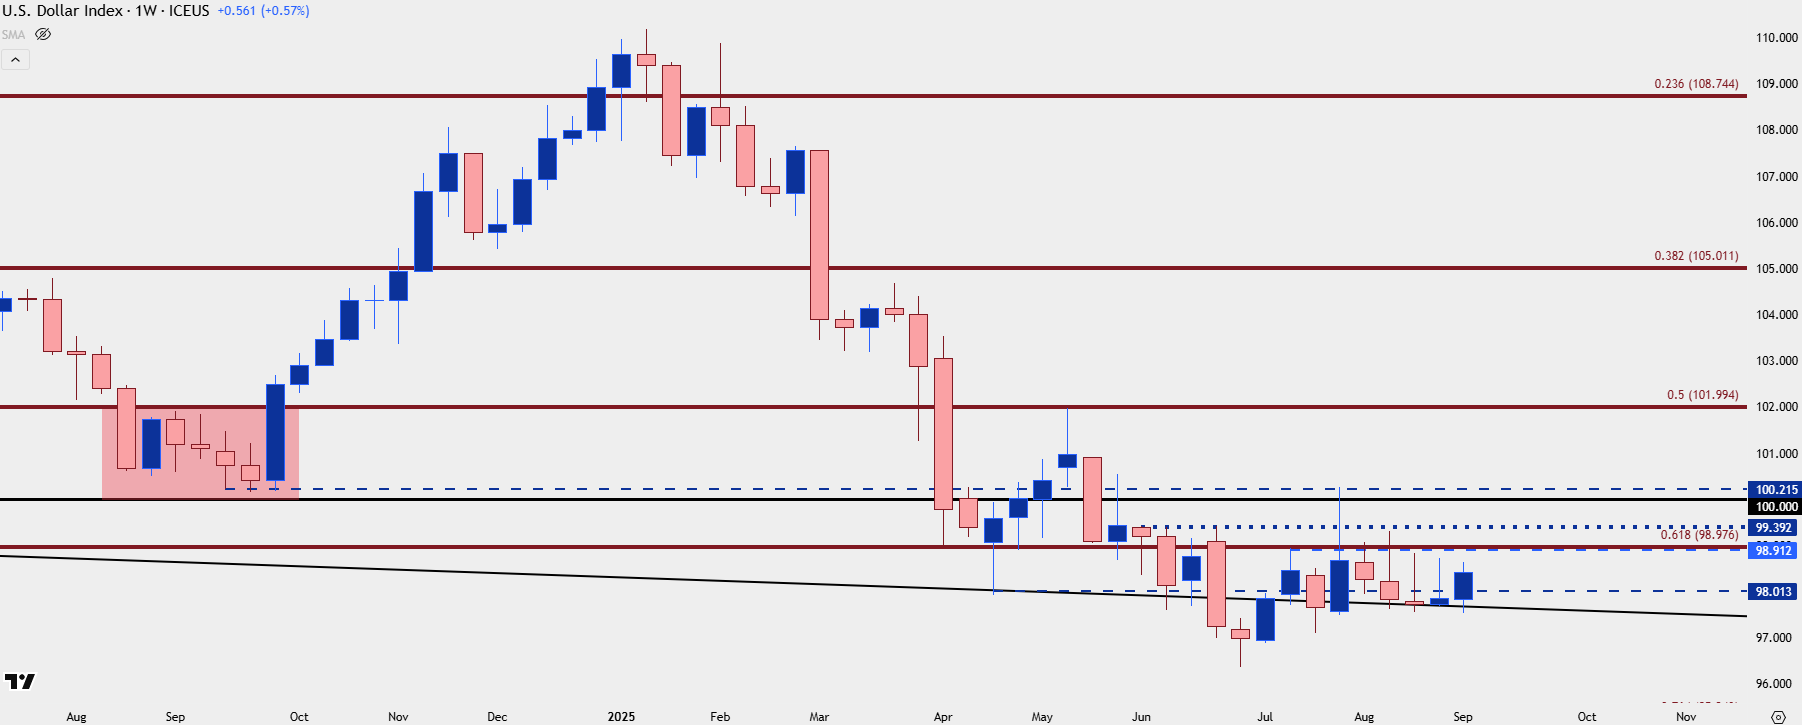
Chart prepared by James Stanley; data derived from Tradingview
USD Daily
The daily chart looks less directional given the past few weeks of ranging price action. But, that does help to establish some additional lines in the sand given that there’s been a hold of support above July’s higher-low combined with continued resistance inside of that 98.98 level looked at above. Just above that price is a prior swing high at 99.39, and that’s followed by a major spot of resistance at 100-100.22, as the latter level was both the 2023 low and the August 1st swing high, which printed just ahead of the NFP.
For support, 97.50 is the immediate level of interest and below that, it’s 97.11 which was the higher-low in late-July that printed just ahead of the FOMC meeting.
US Dollar Daily Chart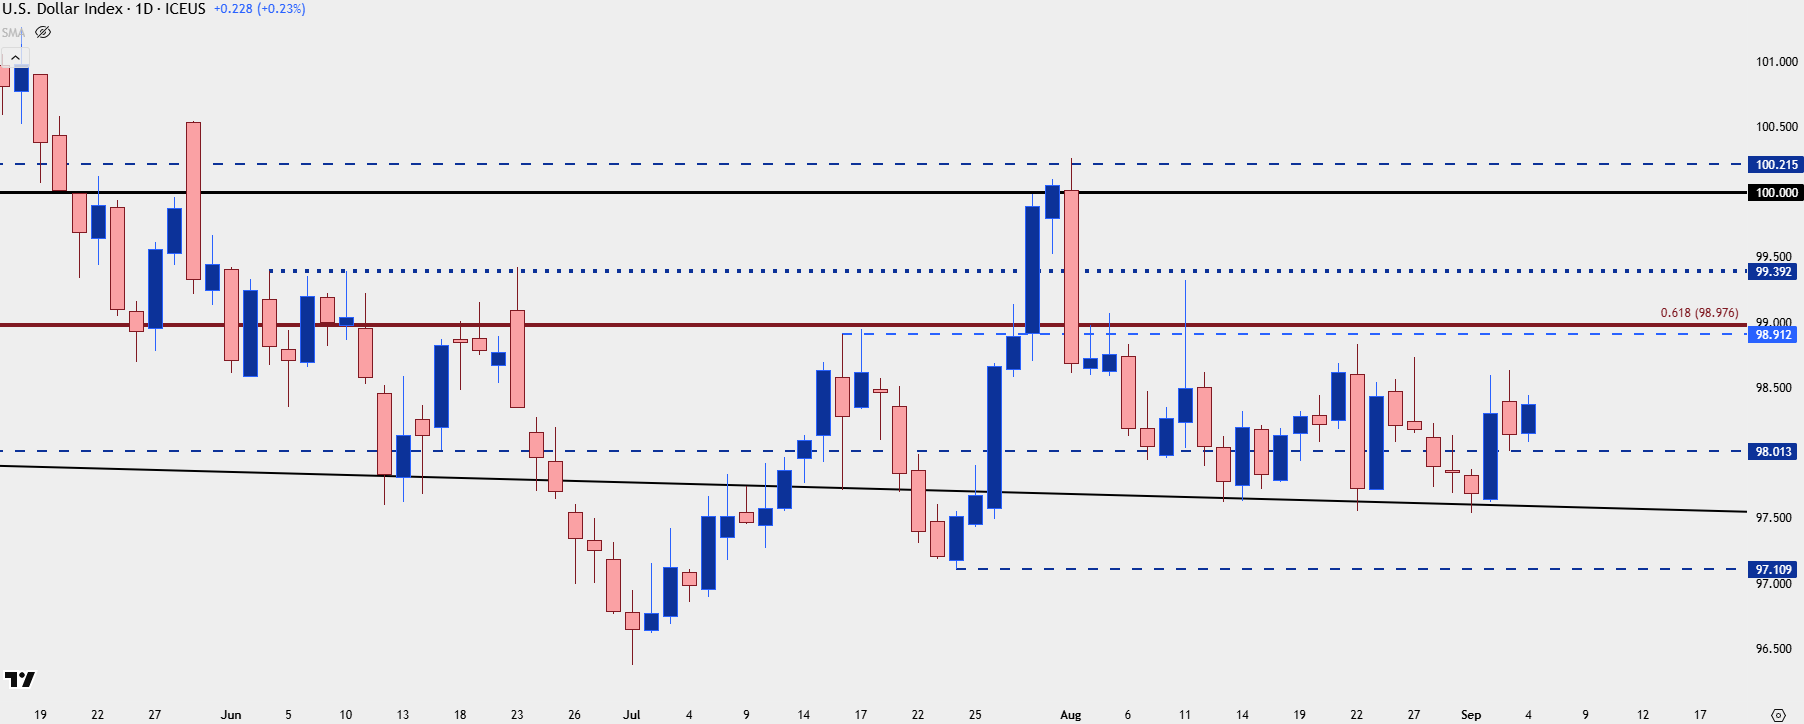
Chart prepared by James Stanley; data derived from Tradingview
EUR/USD
If we’re going to see a USD breakdown we’re probably also going to need to see a EUR/USD breakout. After all, the Euro is a whopping 57.6% of the DXY basket and this is where matters get messy as a prolonged rally in the Euro bring on growth fears in Europe, which bear some relationship with US economic performance.
As USD bears have been stalled since the Q3 open, so too have EUR/USD bulls. The pair has, however, continued to hold resistance in that key Fibonacci zone from 1.1686-1.1748 and that remains in-play. I also have support showing at an upward-sloping trendline and while Q3 has essentially been one big symmetrical triangle, given the prior upside trend that can be qualified as a bull pennant, which would be very similar to the setup I had shown in gold just ahead of Jackson Hole that’s currently led into a parabolic breakout.
EUR/USD Daily Price Chart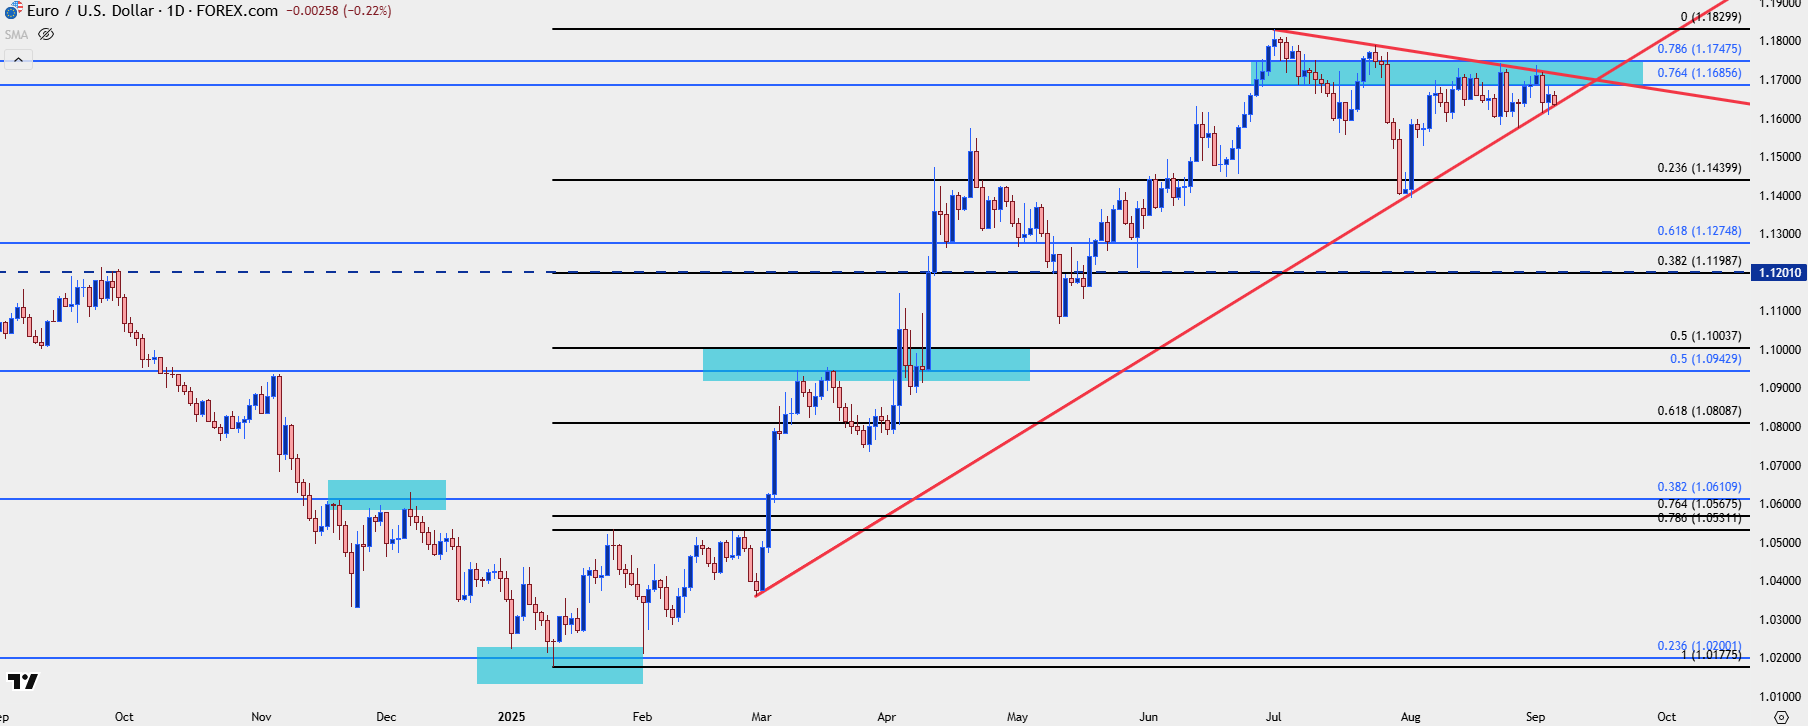
Chart prepared by James Stanley; data derived from Tradingview
EUR/USD Shorter-Term
That bull pennant above can also be coupled with a shorter-term inverse head and shoulders formation, which also points to the possibility of bullish breakout. And like I looked at in the Tuesday webinar I think the more proactive question for that scenario is what happens after? Are bulls going to be able to come in to support higher-lows and drive for a 1.2000 test? If so, then current resistance can be repurposed as support at levels like 1.1748 or perhaps even 1.1686 provided a higher-high prints.
But – if bulls fail to continue the run despite the print of a fresh high, we may soon have that capitulation scenario to work with.
EUR/USD Four-Hour Chart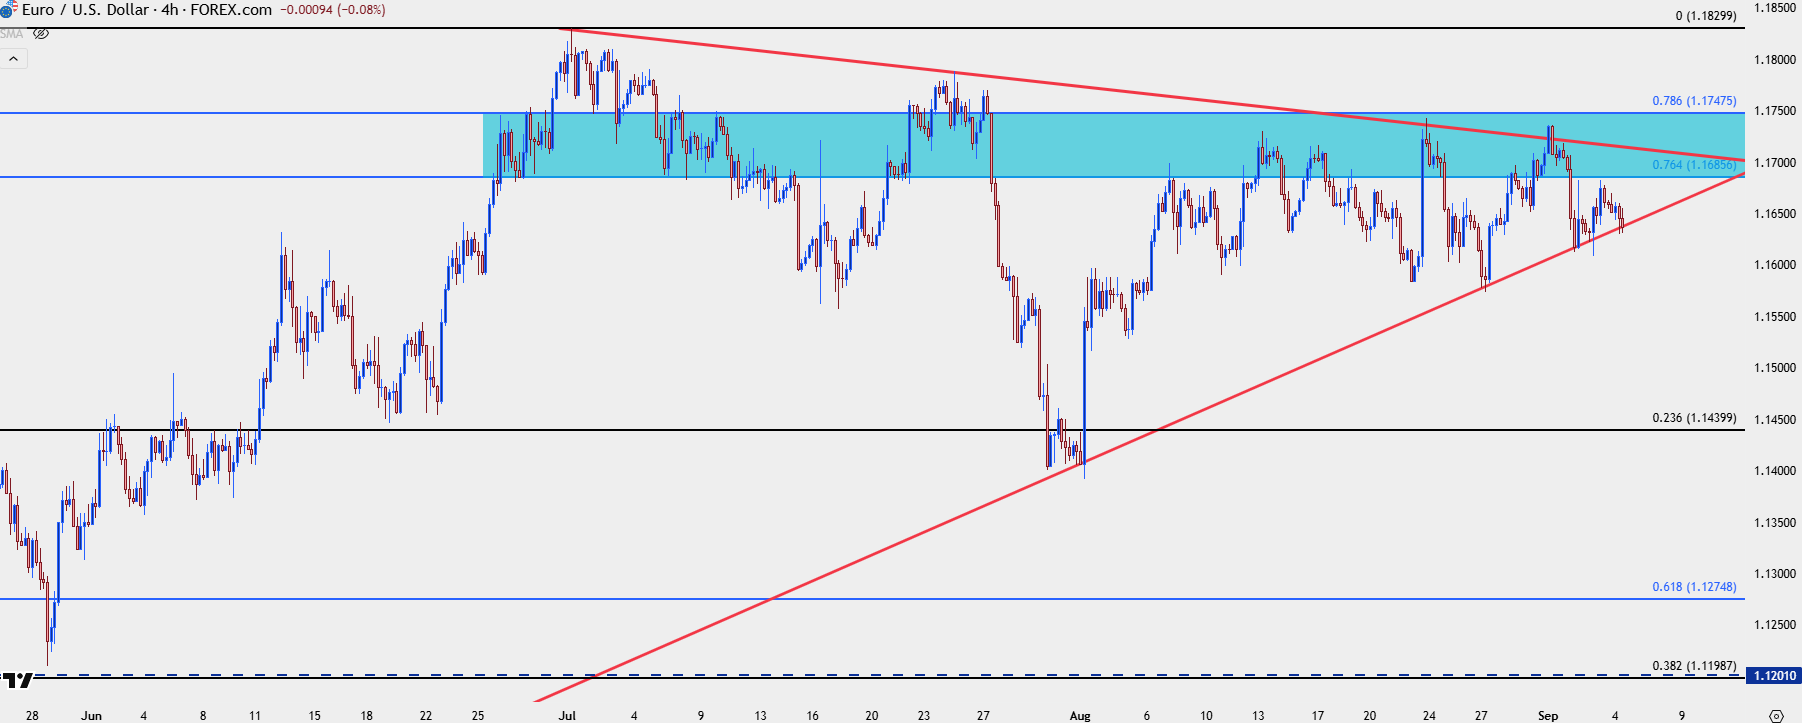
Chart prepared by James Stanley; data derived from Tradingview
GBP/USD
For USD weakness scenarios I’m still partial to Cable. The setup from the Tuesday webinar remains of interest as the Tuesday daily bar closed above that 1.3389 Fibonacci level and yesterday showed a strong bullish reaction to go along with some USD-weakness. At this point it’s the same 1.3389-1.3414 support zone that was in-play in July and again after the USD reversal in early-August that remains in-play. A hold at this zone presents a shorter-term higher-low, which opens the door for mean reversion back towards the 1.3500 handle, with 1.3542 followed by the zone from 1.3593-1.3617.
GBP/USD Daily Price Chart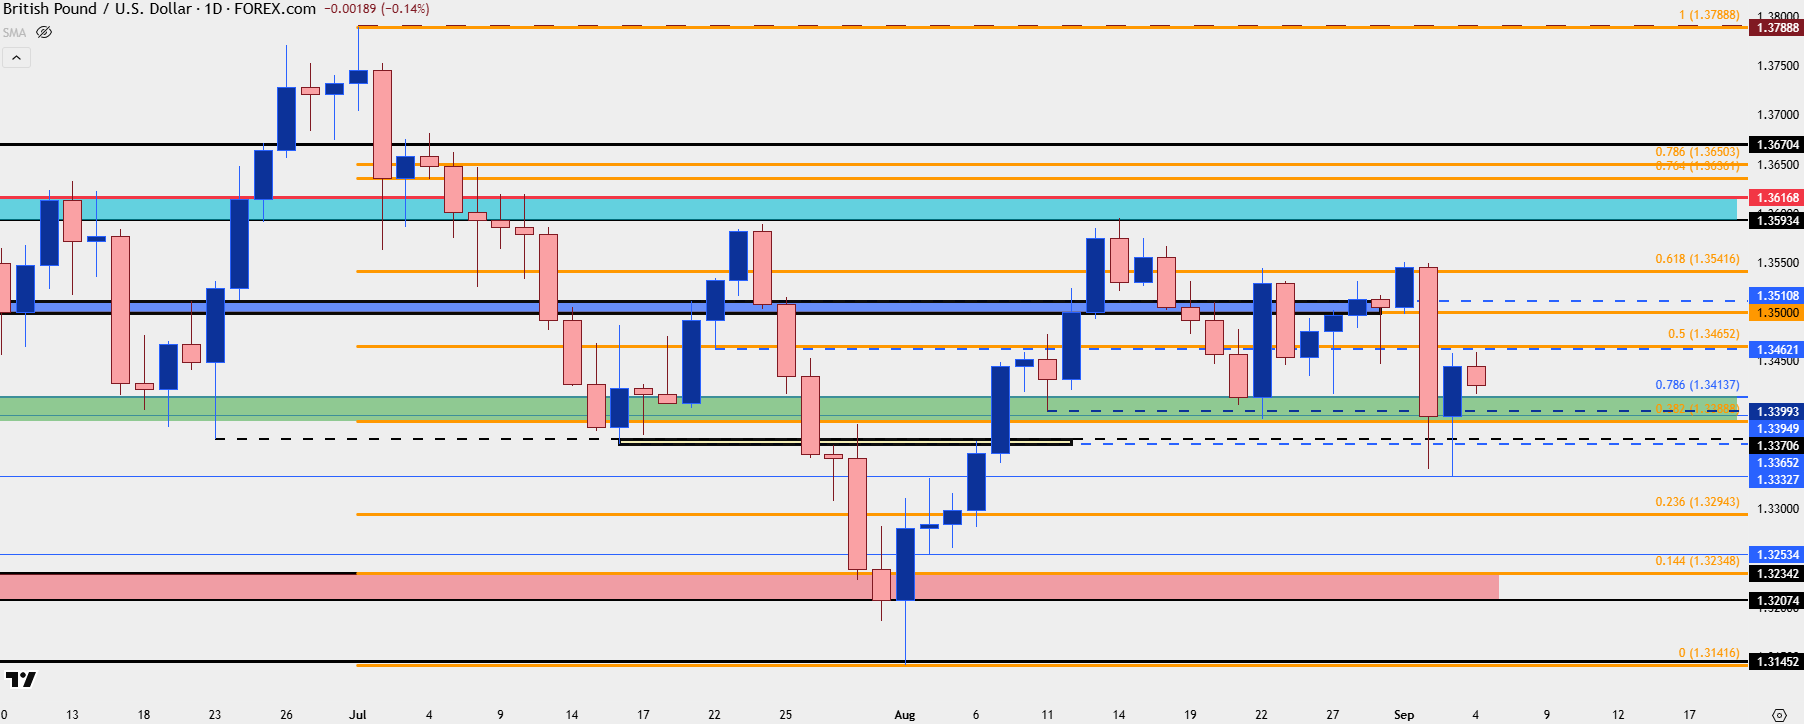
Chart prepared by James Stanley; data derived from Tradingview
USD/JPY
I still think this is the pair that has larger macro concerns with the USD despite the Yen’s 13.6% clip in the DXY basket against the much larger 57.6% allocation of Euro. But, one look at last Q3 highlights this dynamic well, as USD went oversold into the September rate cut and that was in large part pushed by carry unwind in USD/JPY.
And for this year, USD/JPY pushed lower into the April test of 140.00, but since then has been showing higher-lows to go along with the more recent episode of stall in the USD. The weekly chart shows this well, as the pair has pushed back up for a test of the 200-day moving average that it hasn’t closed a weekly bar above since back in February.
USD/JPY Weekly Chart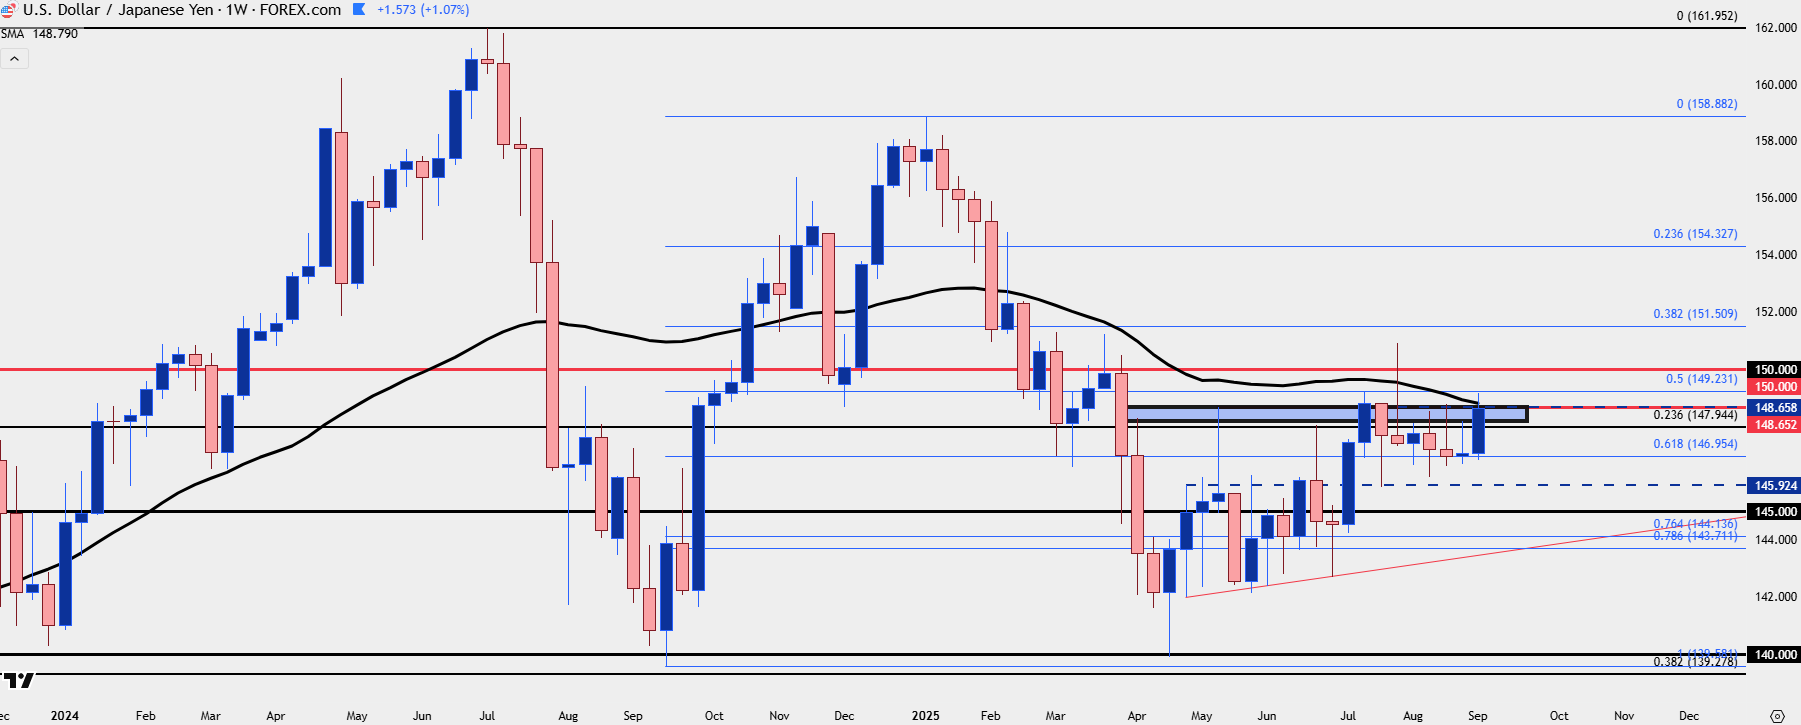
Chart prepared by James Stanley; data derived from Tradingview
USD/JPY
USD/JPY shorter-term shows a pretty consistent range after that NFP-fueled sell-off on August 1st and deductively this sets the pair up as attractive for USD-strength scenarios. But, that said, there may be more attractive backdrops elsewhere in the Yen such as EUR/JPY or GBP/JPY that can both also be argued for Yen-weakness backdrops.
In USD/JPY, we’ve seen a hold of support at a familiar Fibonacci level of 147.94 and that’s the price bulls need to hold to retain control. Below that, 146.95 sets up above 145.92. For resistance, there’s a level at 149.23 followed by the big figure at 150.00.
USD/JPY Daily Chart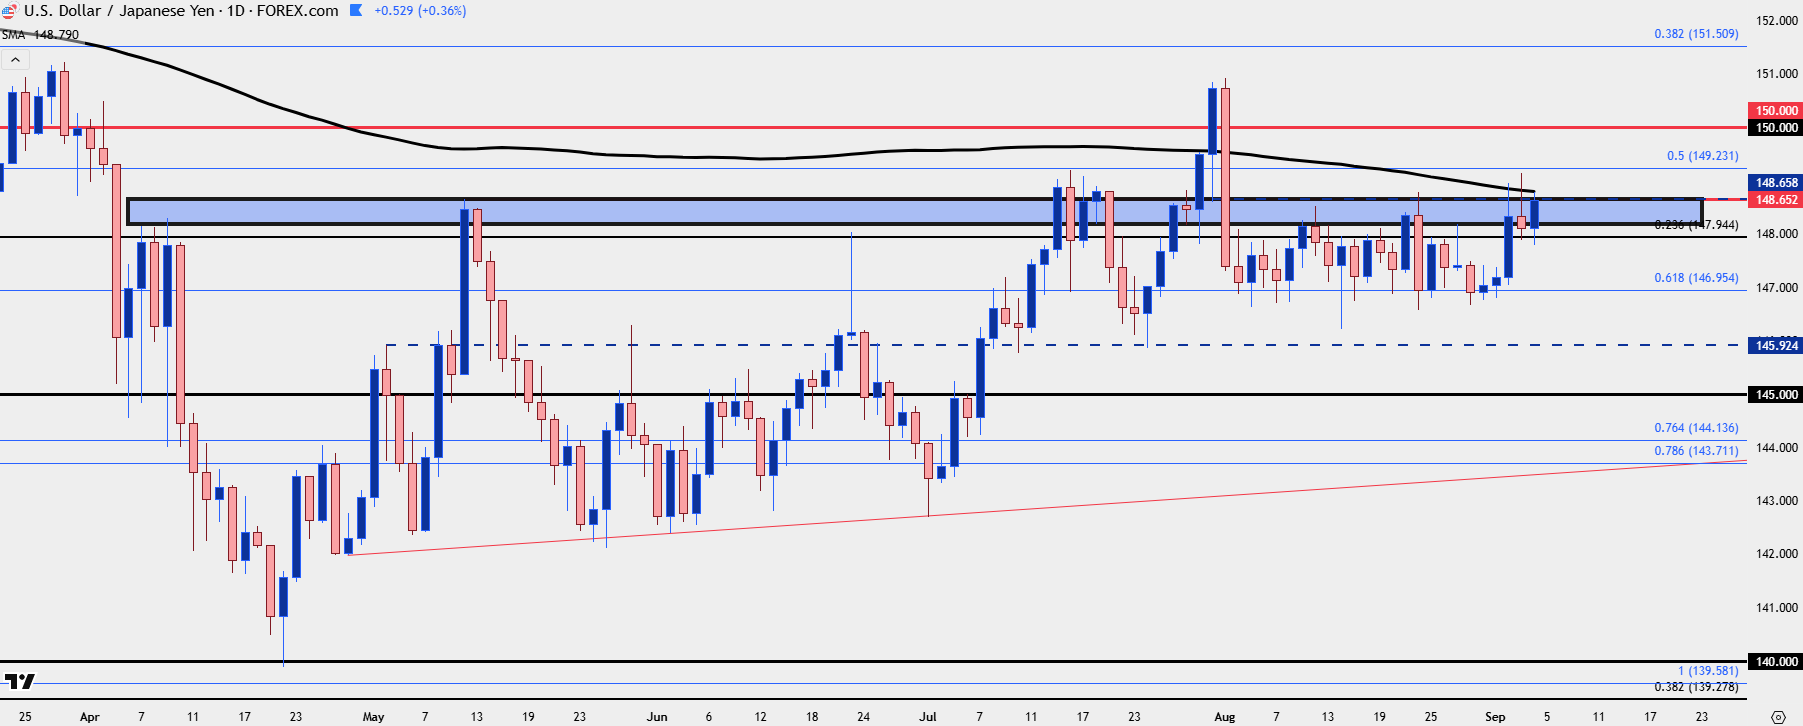
Chart prepared by James Stanley; data derived from Tradingview
USD/CAD
For USD-strength I remain interested in USD/CAD. The pair has come close to recovering the NFP sell-off in the pair but perhaps more importantly USD/CAD retains bullish structure, as looked at in the Tuesday webinar.
There’s been a hold of support around the 1.3750 zone, which was horizontal resistance from the ascending triangle formation, and the recent low has held above the prior test of that zone to allow for a higher-low.
USD/CAD Daily Chart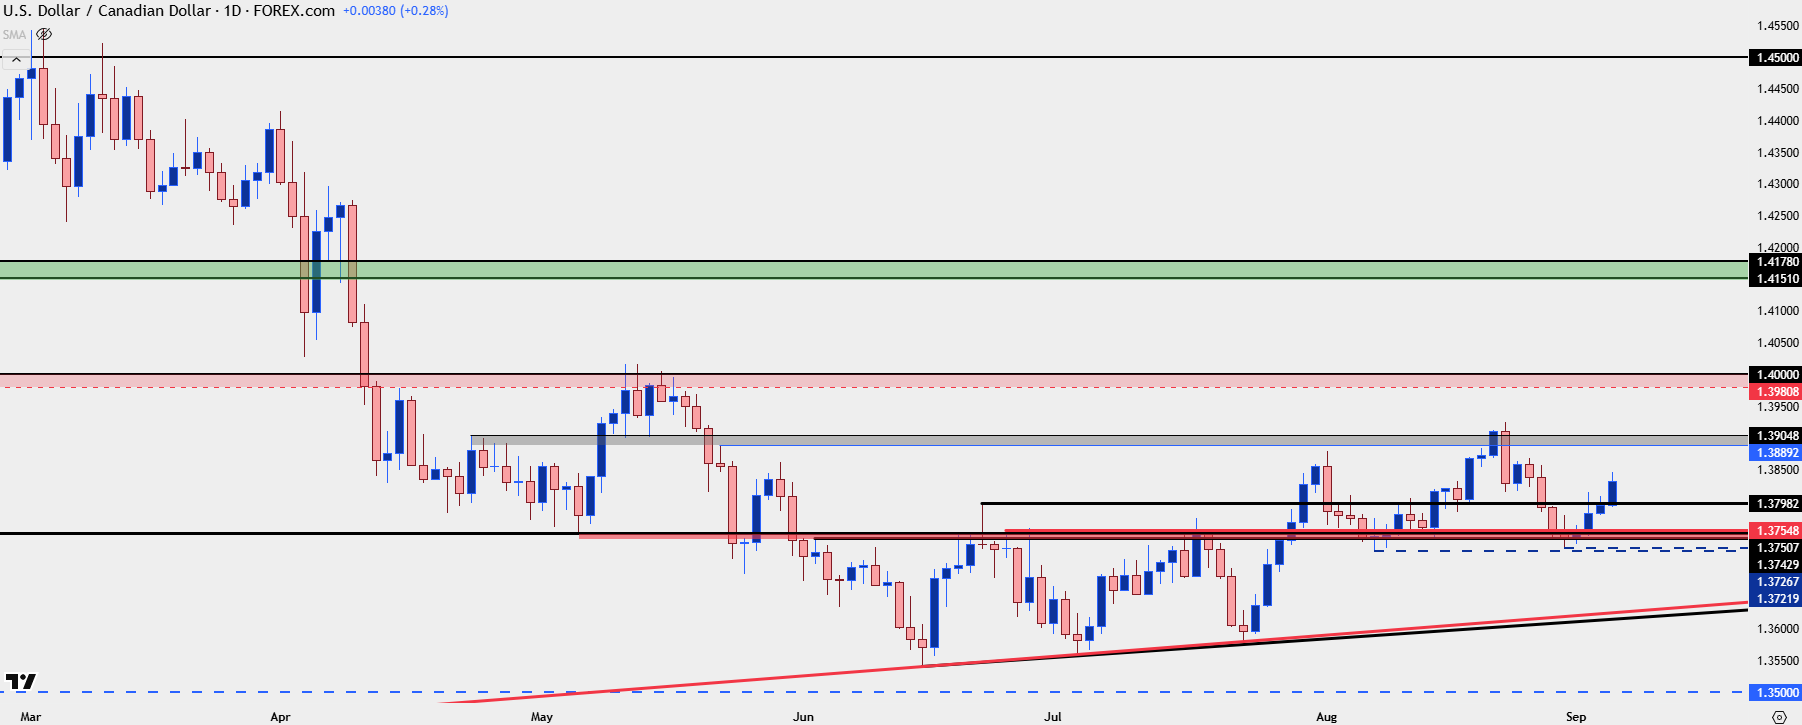
Chart prepared by James Stanley; data derived from Tradingview
--- written by James Stanley, Senior Strategist


The complete CFD trading experience
Award-winning platforms, competitive spreads, low commissions and dedicated support.
We live and breathe the markets and are dedicated to helping traders realise their ambitions as we continue to set the industry bar.
Economic calendar
Web Trader platform
Our sophisticated web-based platform is packed with features.
Related articles
USD/CAD shooting star puts September surge on notice
USD/CAD has printed a clear bearish reversal pattern after an extraordinary September surge, but confirmation may depend heavily on how US Treasury yields react to Friday’s payrolls report.

USD/MXN Analysis: Is Super Peso Starting to Fade?
Over recent trading sessions, the Mexican peso has continued to show signs of weakness against the U.S. dollar. This can already be seen in USD/MXN, which has gained more than 1.7% over the last three sessions, highlighting sustained buying pressure in favor of the dollar in the short term.


Canadian Dollar Analysis: USD/CAD Returns to July Highs Ahead of NFP
The Canadian dollar continues to face one of its most challenging environments in recent months when it comes to maintaining strength against the U.S. dollar. The weakness of the Canadian currency is clearly reflected in USD/CAD, which has now recorded nine consecutive bullish sessions and gained more than 1.7% during that period.
StoneX Europe Ltd may make third party material available on this website which may contain information included but not limited to the conditions of financial markets. The material is for information purposes only and does not contain, and should not be construed as containing, investment advice and/or investment recommendation and/or an investment research and/or an offer of or solicitation for any transactions in financial instruments; any decision to enter into a specific transaction shall be made by the client following an assessment by him/her of their situation.
StoneX Europe Ltd makes no representation or warranty and assumes no liability as to the accuracy or completeness of the information provided, nor any loss arising from any investment based on a recommendation, forecast or other information supplied. You should always seek independent advice as to your suitability to speculate in any related markets and your ability to assume the associated risks, if you are at all unsure. We are not under any obligation to update any such material. Any opinion made may be personal to the author and may not reflect the opinion of StoneX Europe Ltd.