







USDJPY, Nasdaq Forecast: Rate Hold Expectations Pressure Markets
USDJPY, Nasdaq Forecast: The Japanese Yen is back at BOJ intervention risk levels, and the Nasdaq is struggling below the 22,000-threshold with a more hawkish-than-expected Fed tone. Non-farm payrolls, earnings, and inflation metrics are the next key events likely to shift the market tone.
Share this:

Article Outline
- Key Events: Fed Rate Expectations, Tech Sector, and Non-Farm Payrolls
- Technical Analysis: USDJPY and Nasdaq (3-Day Time Frame)
- Technical Analysis (TA) Tip: Forecasting with Fibonacci Tools
2025 Fed Rate Expectations
According to the CME Fed Watch Tool, the market leans toward a 95% probability of a rate hold at the January meeting, reflecting the more hawkish-than-expected stance in the FOMC minutes regarding the rate cut trajectory for 2025. Global central banks are expressing inflation concerns tied to Trump’s presidency, leading to a cautious approach to rate cuts in 2025.
Source: CME Fed Watch Tool
Meanwhile, the strength of the US Dollar Index continues to pressure global currencies, while US indices face bearish momentum amid 2025 uncertainties. Earnings results later this month are expected to increase volatility risks for US indices. A positive performance in the tech sector may spur another Nasdaq rally despite ongoing market challenges in 2025.
USDJPY
In currency markets, the strong dollar exerts significant pressure on global currencies, particularly the Japanese Yen, which is approaching record lows and raising BOJ intervention risks. The USDJPY pair is currently trading near 158, with the 160-level looming ahead. This critical level could prompt BOJ intervention, triggering potential volatility spikes.
Technical Analysis: Quantifying Uncertainties
USDJPY Forecast: 3Day Time Frame – Log Scale
Source: Tradingview
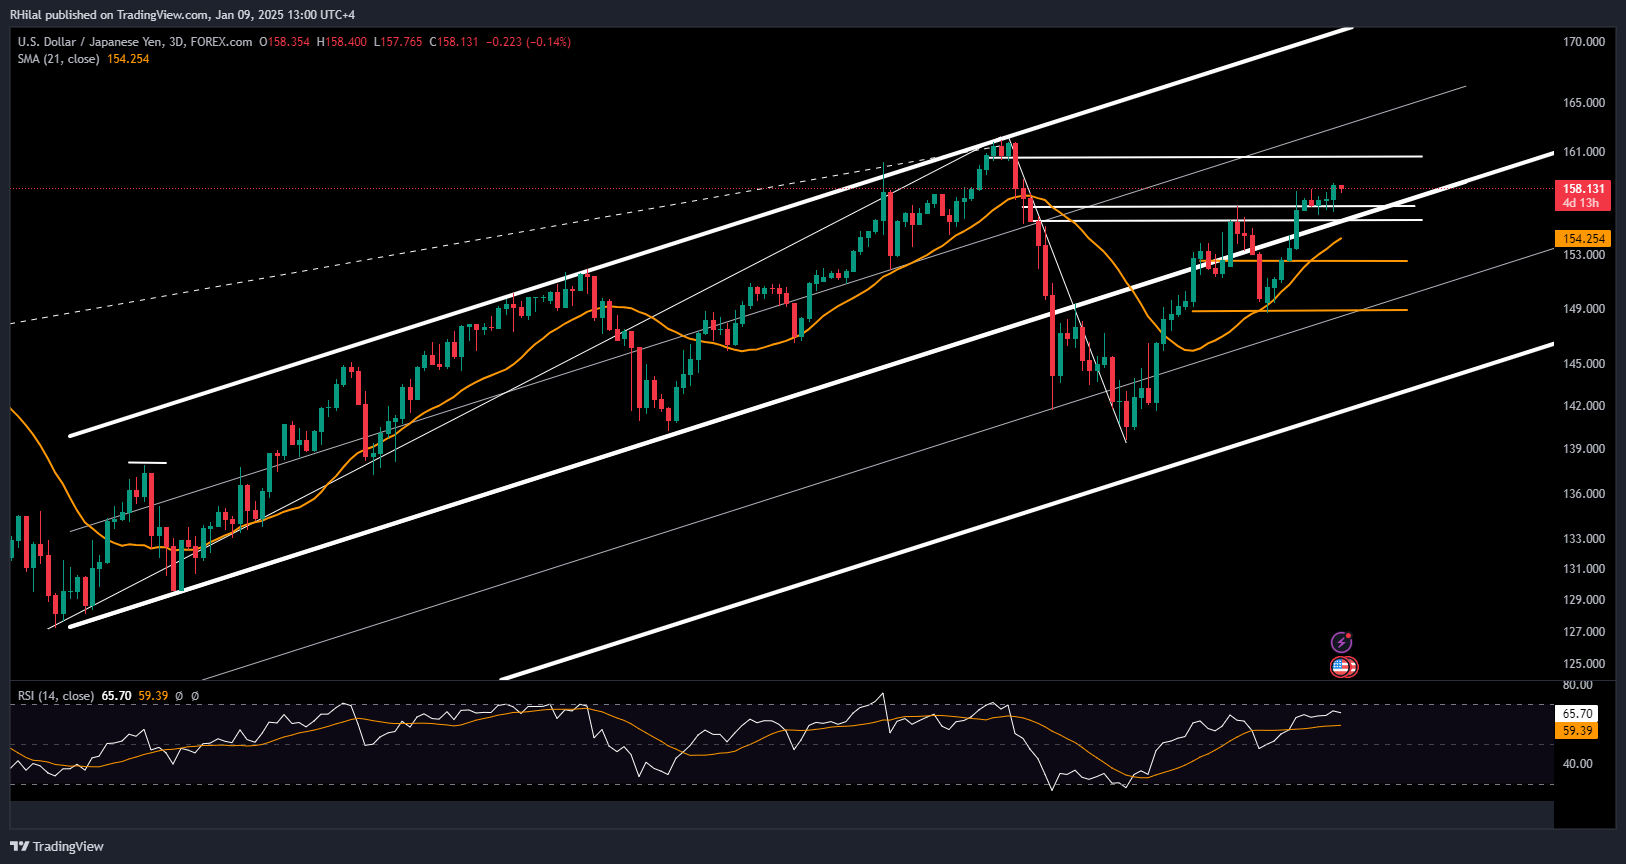
The USDJPY pair reflects bullish potential, maintaining alignment with its primary up trending channel since 2023 and trading above its 21-day SMA. Using the Fibonacci extension tool applied to the 2023 low, 2024 high, and 2024 low, the levels of 0.236 and 0.5 align with key levels at 148.60 and 156.70.
The next significant level, at the 0.618 Fibonacci extension, aligns with the 160-mark, where the RSI is expected to reach extreme overbought levels, increasing the risk of BOJ intervention and potential reversals.
On the downside, 156.70 and 155.50 act as key support levels, aligning with the trendline connecting consecutive lows from January 2023 to August 2024. A break below these levels and the primary trendline could deepen bearish sentiment, with the next support levels anticipated around 153.50 and 149, signaling potential Yen strength recovery.
Nasdaq Forecast: 3Day Time Frame – Log Scale
Source: Tradingview
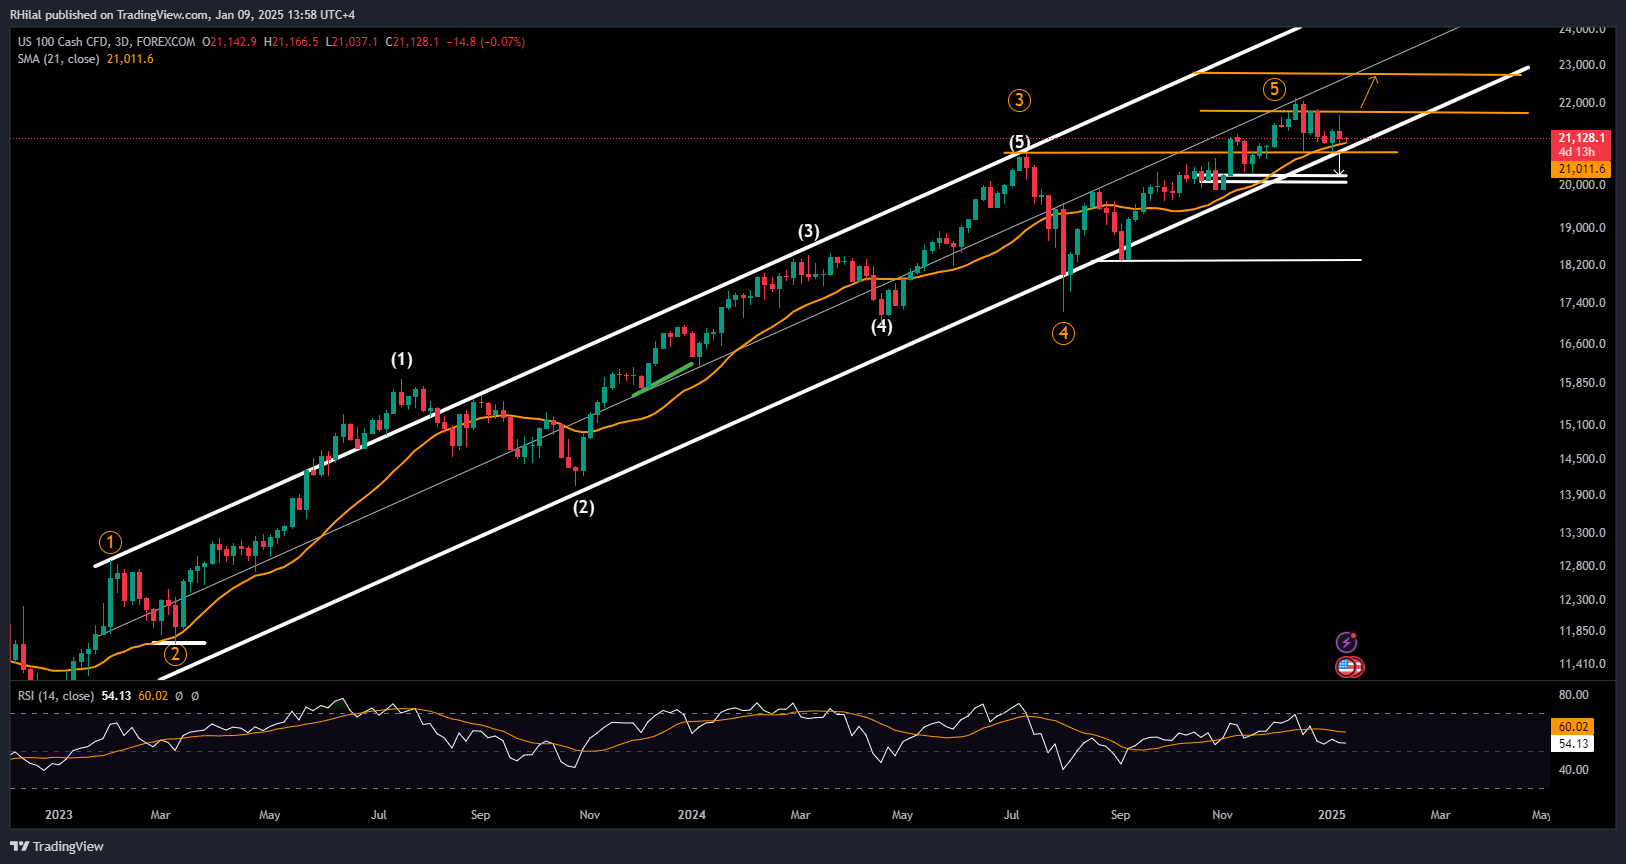
The Nasdaq's uptrend continues to respect the borders of its primary ascending channel, established from the 2022 lows. Applying the Fibonacci retracement tool to the uptrend from the August 2024 low (17,200) to the 2024 high (22,130), potential declines below the 20,700-mark can be assessed.
The recent low at 20,780 found support at the channel's bottom border and the July 2024 high. A break below the 20,700 support is necessary to shift sentiment toward bearish territory, with further declines potentially extending toward 20,200, 20,000, and 19,700.
On the upside, applying the Fibonacci extension tool to the March 2023 low, July 2024 high, and August 2024 low, a sustained close above the 21,800 or 22,000-mark could trigger a rally toward the 0.618 Fibonacci extension level near 22,880.
Written by Razan Hilal, CMT
Follow on X: @Rh_waves
On You tube: Forex.com
Related tags:




The complete CFD trading experience
Award-winning platforms, competitive spreads, low commissions and dedicated support.
We live and breathe the markets and are dedicated to helping traders realise their ambitions as we continue to set the industry bar.
Economic calendar
Web Trader platform
Our sophisticated web-based platform is packed with features.
Related articles

USD/JPY Update: Can the Japanese Yen Sustain Its Recovery?
Short-term price action around the Japanese yen has started to show some relative improvement over recent sessions. This can be seen in the recent performance of USD/JPY, which has now recorded three consecutive daily declines in favor of the Japanese currency, resulting in a depreciation of roughly 0.35% over the period.


Nasdaq 100 forecast: US tech stocks extend decline as AI concerns intensify
Following the CPI-related drop yesterday, Nasdaq 100 futures have fallen further following a weak handover from Asian markets overnight. US stocks came under intense pressure after a hotter-than-expected inflation report revived bets on further Federal Reserve rate hikes and sent Treasury yields and the dollar higher. While both the dollar and yields subsequently dropped back to pre-CPI levels and more in the case of yields, the Nasdaq has failed to respond positively as concerns over AI trade remained.


Nasdaq 100 selloff has a twist we haven't seen this year
We've seen three substantial Nasdaq 100 selloffs this year, only for buyers to return. But the Treasury market's reaction to the latest decline is very different, raising questions about whether this is another temporary scare or something more substantial.
StoneX Europe Ltd may make third party material available on this website which may contain information included but not limited to the conditions of financial markets. The material is for information purposes only and does not contain, and should not be construed as containing, investment advice and/or investment recommendation and/or an investment research and/or an offer of or solicitation for any transactions in financial instruments; any decision to enter into a specific transaction shall be made by the client following an assessment by him/her of their situation.
StoneX Europe Ltd makes no representation or warranty and assumes no liability as to the accuracy or completeness of the information provided, nor any loss arising from any investment based on a recommendation, forecast or other information supplied. You should always seek independent advice as to your suitability to speculate in any related markets and your ability to assume the associated risks, if you are at all unsure. We are not under any obligation to update any such material. Any opinion made may be personal to the author and may not reflect the opinion of StoneX Europe Ltd.