




EUR/USD, USD/JPY, VIX, Gold, Crude oil: COT Report Analysis
COT report shows euro and yen positioning turning more bullish, while gold sentiment builds, VIX longs collapse, and crude oil nears net-short levels.
Share this:

There was little change in weekly exposure among most FX majors last week, with net positioning shifting by 6k contracts or less. The exception was the Japanese yen (JPY), where a mix of short covering and new long positions saw net-long exposure rise by 18.4k contracts.
Net-short exposure to Canadian dollar (CAD) futures was trimmed by just 50 contracts, while net-shorts on the British pound (GBP) rose by 465 contracts. Bulls added 6k contracts to net-long exposure in euro (EUR) futures, while large speculators reduced net-short exposure to Australian dollar (AUD) futures by 3.5k contracts.
Gold attracted further buying interest, with both large speculators and asset managers increasing net-long exposure, though positioning remains well below extreme levels. Appetite for risk also held firm, with net-long exposure to VIX futures falling by 18.4k contracts. Asset managers are now close to flipping net-short, holding only 21 contracts on the long side. Crude oil traders cut longs by 18.8k contracts (-6.4%).
View related analysis:
View related analysis:
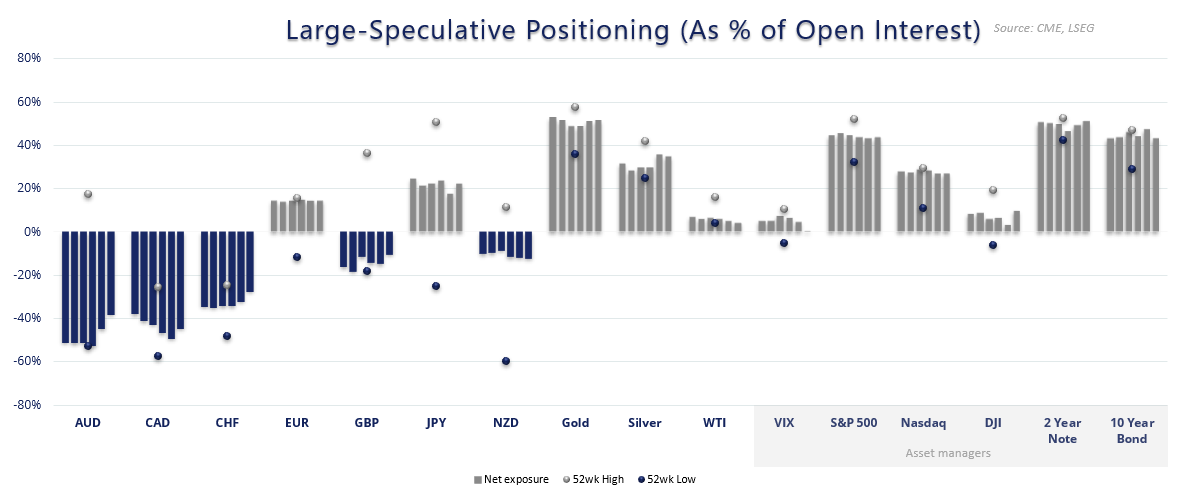

Chart analysis by Matt Simpson - data source: LSEG, CME
Weekly COT Report Highlights:
- US Dollar (USD): Net-short exposure rose $2.5 billion to -$8.7 billion last week
- European dollar (EUR): Asset managers increased net-long exposure for a fifth week, by 3.4k contracts to 38.2k contracts (highest since December 2023)
- Japanese yen (JPY): Net-long exposure increased by 18.4k contracts among large speculators
- Australian dollar (AUD):
- Canadian dollar (CAD): Net-short exposure remained effectively flat at around -10.9k contracts 59 overo-week
- Swiss franc (CHF): Net-short exposure increased to a 20-week high
- New Zealand dollar (NZD):
- Gold (GC): Net-long exposure rose to a 6-month high among large specs
- Crude Oil (WTI): Managed funds are on the cusp of flipping ot net-short exposure for the first time since 2008


EUR/USD Positioning: Euro Futures – Weekly COT Report Analysis
Like the Japanese yen, the euro remains locked in a frustrating sideways trade. However, the broader uptrend continues to favour an eventual bullish breakout, supported by positioning in the EUR/USD futures market.
Managed funds increased their net-long exposure to euro futures to the most bullish level since December 2023. This also marked the fifth consecutive week of rising net and gross-long exposure, alongside a fifth week of reduced shorts.
The positioning bias is clearly bullish, though prices need to confirm soon. Otherwise, there is a risk that longs could be unwound, triggering a move lower against current sentiment.
EUR/USD weekly futures positioning chart showing euro price consolidation near $1.17, with asset managers holding their most bullish net-long exposure since December 2023, supported by rising longs and falling shorts.
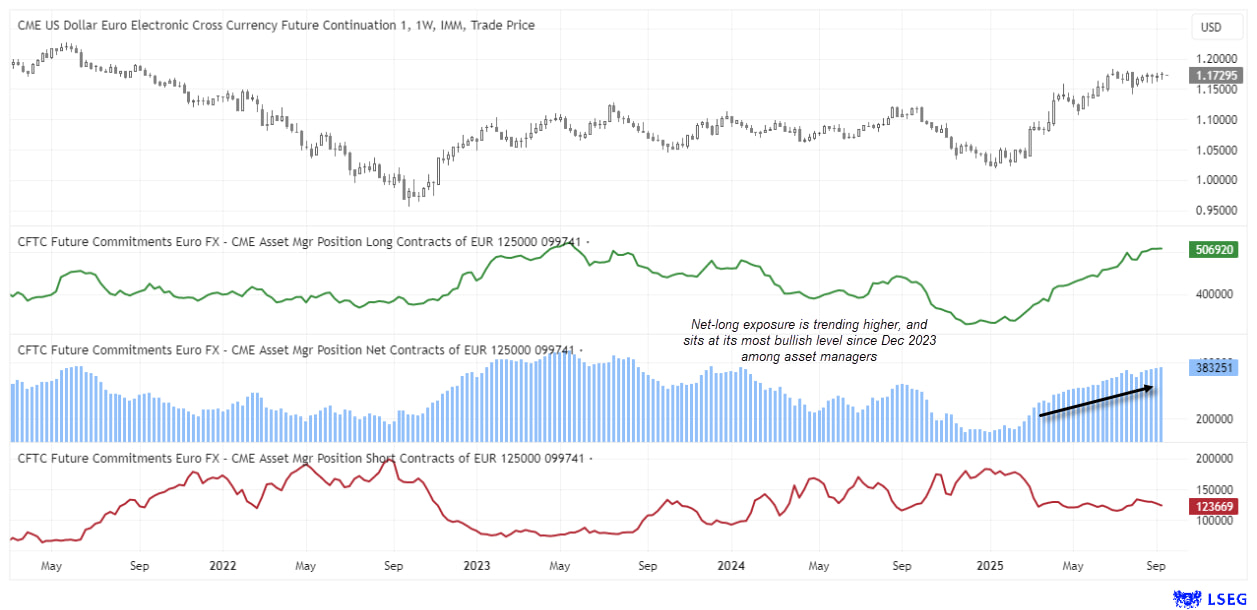
Chart analysis by Matt Simpson - data source: LSEG, CME
Volatility Index Positioning (VIX): Weekly COT Report Analysis
I am beginning to wonder if sentiment is in need a bit of a shakeup, given Wall Street indices continue to push to new highs while the volatility index (VIX) remains low. Positioning data on the VIX futures market may also point towards a level of complacency, which tends to appear before any shakeup.
Managed funds were net-long by a mere 2.8k contracts, their least bullish level since late February. Large speculators pushed their net-short exposure to their most bearish level since March 2021. Total open interest (proxy for volume) has also risen to its highest level since March 2024, and second highest since 2019.
Now that it not to say that any spike on unpleasant volatility is imminent. But it is something to consider, and for traders to be on guard for at least a minor quibble, while Wall Street indices keep reaching new highs.
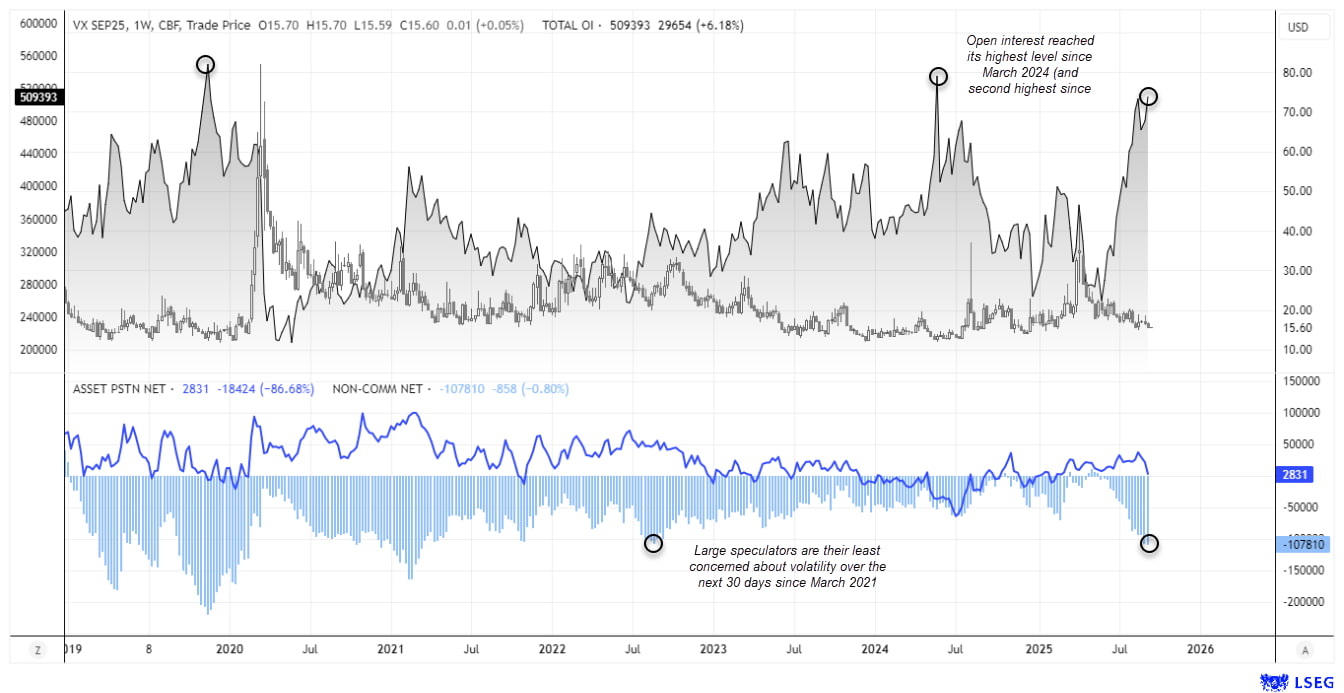
Chart analysis by Matt Simpson - data source: LSEG, CME


JPY/USD Positioning: Japanese Yen Futures – Weekly COT Report Analysis
The trading range for USD/JPY has remained frustratingly narrow in recent weeks, not helped by renewed confidence of Fed cuts alongside hopes of BOJ hikes being pushed back. But futures traders appear to be betting on a stronger Japanese yen (or bearish USD/JPY) looking at the recent COT report.
Large speculators increased their gross-long exposure by 87.4k contracts (25%) – their fastest weekly increase in five months. While net-long exposure is up to a seven-week high, gross-long exposure has reached a 13-week high and risen for five consecutive weeks. Gross-shorts were also reduced by -12.4k contracts (-12.3%). Asset managers also increased their gross-long exposure by 11.8k contracts (8.2%) to suggest bullish pressure is building on the Japanese yen, which could eventually see USD/JPY break lower.
Traders should keep an eye on this week’s Bank of Japan (BOJ) meeting for clues. While they seem unlikely to hike, we could find comments over the coming weeks are supportive of such action in futures, which could be the catalyst for the yen to break its range.
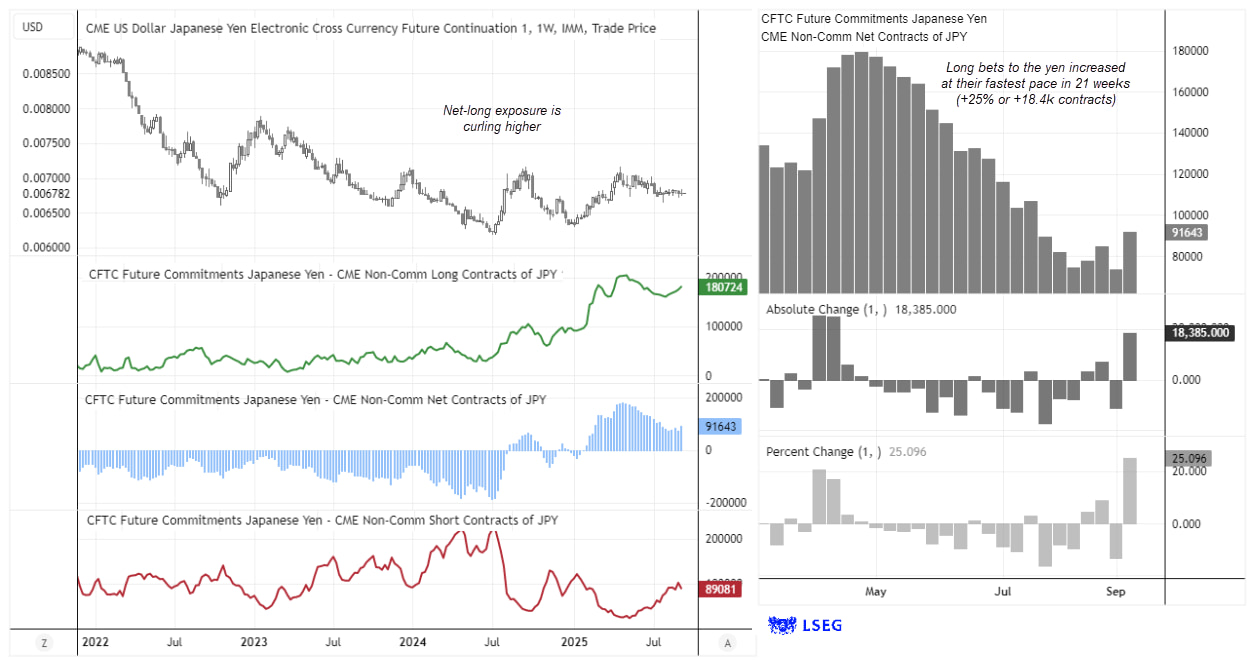
Chart analysis by Matt Simpson - data source: LSEG, CME
Gold Futures Positioning (GC): Weekly COT Report Analysis
Gold extended its rally for a fourth straight week, with spot prices holding at record highs for a second week in a row. What makes this advance notable is that positioning has yet to catch up — net-long exposure among futures traders remains relatively modest compared to the scale of gold’s breakout.
Large speculators lifted their net-long exposure to a six-month high, while managed funds increased theirs to a five-month high. Neither group is at a positioning extreme, but both show a clear trend of rising longs and suppressed shorts.
With sentiment still far from overstretched, gold continues to look attractive to dip buyers. Talk of a potential run towards the $4,000 level no longer feels outlandish as bullish momentum and positioning align.
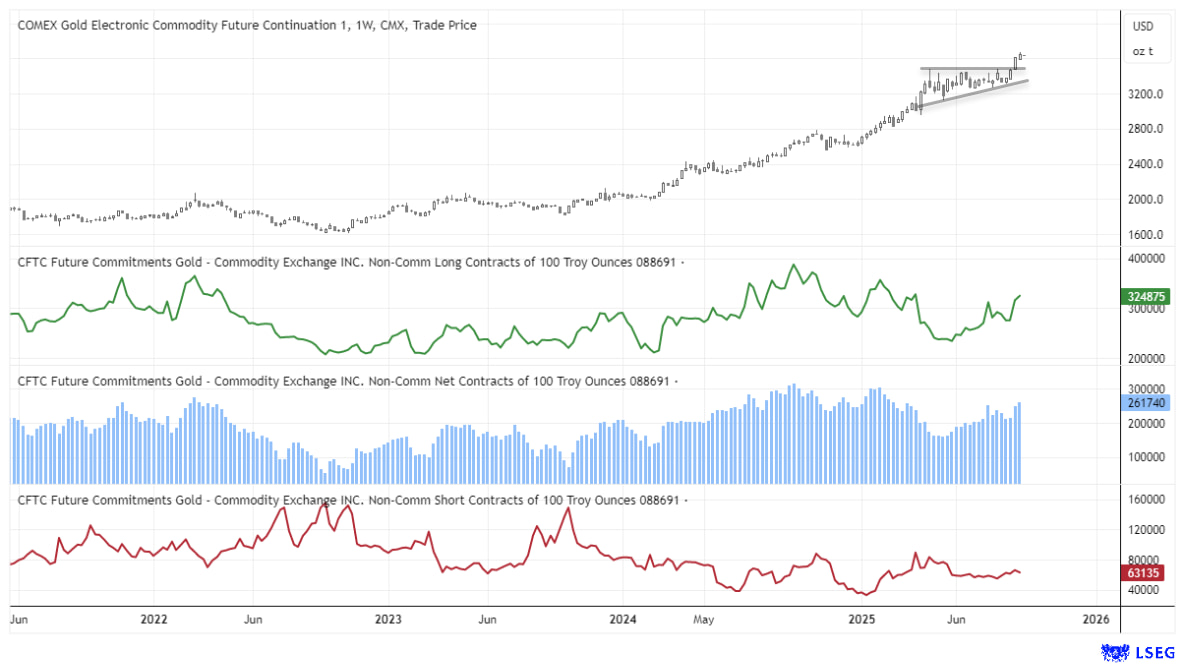
Chart analysis by Matt Simpson - data source: LSEG, CME


WTI Crude Oil Positioning (CL): Weekly COT Report Analysis
Managed funds are turning increasingly bearish on WTI crude oil, with net-long exposure falling to just 10k contracts — the lowest since 2009. This places them on the cusp of flipping to net-short for the first time since 2008.
Rising OPEC+ production and expectations of inventory builds into late 2025, highlighted in the latest EIA outlook, are pressuring sentiment. Adding to the bearish bias, slowing US economic activity raises concerns for global oil demand. Although WTI crude remains above its September low, futures positioning suggests traders are preparing for a potential downside break.
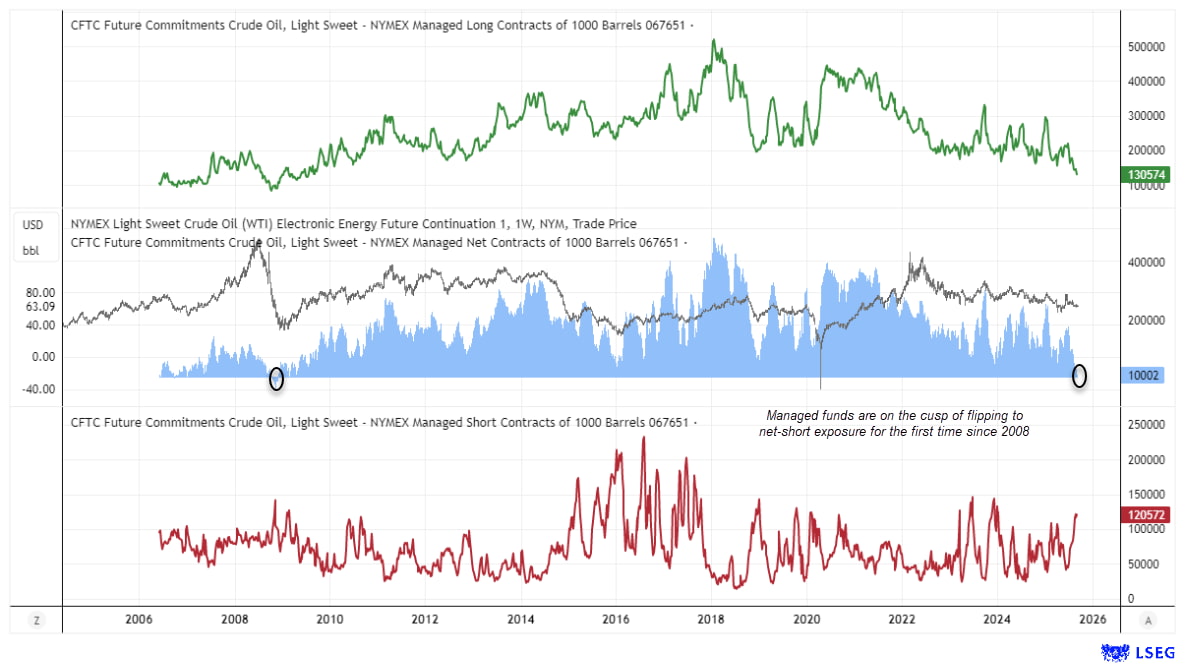
Chart analysis by Matt Simpson - data source: LSEG, CME
View the full economic calendar
View the full economic calendar
-- Written by Matt Simpson
Follow Matt on Twitter @cLeverEdge
How to trade with City Index
You can trade with City Index by following these four easy steps:
- Open an account, or log in if you’re already a customer
• Open an account in the UK
• Open an account in Australia
• Open an account in Singapore
- Search for the market you want to trade in our award-winning platform
- Choose your position and size, and your stop and limit levels
- Place the trade
Related tags:


Open an account in minutes
Experience award-winning platforms with fast and secure execution, and enjoy tight spreads from 0.5 pts on FX and 0.3 pts on indices.
Economic calendar
Web Trader platform
Our sophisticated web-based platform is packed with features.
Related articles

USD/JPY Weekly Outlook: AI earnings could overshadow the Fed and BoJ
AI sentiment has become a major driver of US Treasury yields and USD/JPY. With Microsoft, Alphabet and Amazon reporting this week, central bank decisions may have competition for traders' attention.


USD/JPY Forecast: Is Rising Japanese Inflation Supporting the Yen?
As the trading week comes to an end, one of the most relevant developments in the FX market has been the renewed strength of the Japanese yen. This can be seen in the recent performance of USD/JPY, which has fallen nearly 1.0% over the last two trading sessions, highlighting a meaningful recovery in the Japanese currency against the U.S. dollar.


US Dollar Price Action Setups: EUR/USD, USD/JPY, GBP/USD, USD/CAD
The Dollar is working on its second consecutive red week and while sellers didn’t exactly pounce on fresh lows, there’s an opening door for bears to make a move.

This report is intended for general circulation only. It should not be construed as a recommendation, or an offer (or solicitation of an offer) to buy or sell any financial products. The information provided does not take into account your specific investment objectives, financial situation or particular needs. Before you act on any recommendation that may be contained in this report, independent advice ought to be sought from a financial adviser regarding the suitability of the investment product, taking into account your specific investment objectives, financial situation or particular needs.
StoneX Financial Pte. Ltd., may distribute reports produced by its respective foreign entities or affiliates within the StoneX group of companies or third parties pursuant to an arrangement under Regulation 32C of the Financial Advisers Regulations. Where the report is distributed to a person in Singapore who is not an accredited investor, expert investor or an institutional investor (as defined in the Securities Futures Act), StoneX Financial Pte. Ltd. accepts legal responsibility to such persons for the contents of the report only to the extent required by law. Singapore recipients should contact StoneX Financial Pte. Ltd. at 6826 9988 for matters arising from, or in connection with the report.
In the case of all other recipients of this report, to the extent permitted by applicable laws and regulations neither StoneX Financial Pte. Ltd. nor its associated companies will be responsible or liable for any loss or damage incurred arising out of, or in connection with, any use of the information contained in this report and all such liability is hereby expressly disclaimed. No representation or warranty is made, express or implied, that the content of this report is complete or accurate.
StoneX Financial Pte. Ltd. is not under any obligation to update this report.
Trading CFDs carries a high level of risk that may not be suitable for some investors. Consider your investment objectives, level of experience, financial resources, risk appetite and other relevant circumstances carefully. The possibility exists that you could lose some or all of your investments, including your initial deposits. If in doubt, please seek independent expert advice. Visit www.forex.com/en-sg/terms-and-policies for the complete Risk Disclosure Statement.