



USD/JPY Hits Resistance, Implied Volatility Subdued Ahead of Fed, BOJ
USD/JPY trades near key resistance with implied volatility at multi-month lows ahead of the Fed and BOJ interest rate decisions.
Share this:

USD/JPY remains pinned near key resistance as traders brace for this week’s twin policy decisions from the Federal Reserve and Bank of Japan. Despite the event risk, implied volatility has barely budged, reflecting confidence that the Fed will deliver a 25bp cut while the BOJ maintains its dovish stance. Yet with the yen under pressure and RSI signals flashing overbought, the calm may not last.
View related analysis:
View related analysis:
USD/JPY Consolidates as Traders Eye Fed and BOJ Rate Decisions
Implied Volatility Subdued For USD/JPY Despite Event Risks
You wouldn’t think there was a Bank of Japan (BOJ) or Federal Reserve (Fed) interest rate decision looming, judging by the subdued implied volatility levels of USD/JPY. The one-week IV sits at an annualised rate of 7.6% — less than half its April peak. Perhaps this calm view on volatility perfectly encapsulates market assumptions: the Fed is fully expected to cut rates by 25bp, while the BOJ is assumed to hold steady and maintain a wait-and-see approach.
While I always warn traders to stay alert for a surprise from the BOJ, such a move seems unlikely given Japan’s new dovish Prime Minister and lingering uncertainty around Trump’s latest round of trade talks. It would be truly shocking for the Fed not to cut rates this week, meaning the real focus will likely be on guidance for a follow-up cut in December or early next year.
Whether traders are treated to a surprise or not, I suspect we could see relatively quiet ranges heading into these key events.

Chart analysis by Matt Simpson - Source: LSEG


Japanese Yen Looks Weak Ahead of BOJ
It has been a turbulent few weeks for the Japanese yen — clearly a game of two halves. Yen pairs initially surged on reports of a dovish Prime Minister likely to take office, before the revival of Trump’s tariffs helped the yen recover amid risk-off flows. Yet we’ve now seen a renewed bout of yen weakness as tariff headlines fade and trade deals gain traction.

Chart analysis by Matt Simpson - Source: COMEX, LSEG
- The Australian dollar has led commodity-FX majors higher against the yen, with AUD/JPY up 4.3% over the past six days and now back above 100.
- EUR/JPY has surpassed my bullish target and broken to its highest level since 1991.
- CHF/JPY has reached a fresh record high.
- Even the weak British pound has gained against the yen, sending GBP/JPY to a 12-day high.
- USD/JPY has probed its 9 October high, though Monday’s Doji suggests hesitancy to break higher ahead of key events.


USD/JPY Technical Analysis: US Dollar vs Japanese Yen
With the daily RSI (2) sitting at overbought levels for a third consecutive day — and at its highest reading in 12 days — the upside potential for USD/JPY may now be limited, especially with a doji forming at the 9 October high. The fact that this level aligns with an elongated, bearish-closing marubozu candle underscores its technical significance and raises the odds of at least a minor pullback, unless the Fed delivers a dovish surprise this week.
The 1-hour chart shows a lower high forming on Monday, alongside a multi-day bearish divergence on the RSI (14). Bears could look to fade minor rallies within Monday’s upper wick, anticipating a modest retracement. However, expectations for a deeper decline may depend on a decisively dovish tone from the Fed, given the yen’s broader weakness ahead of a likely cautious BOJ meeting.
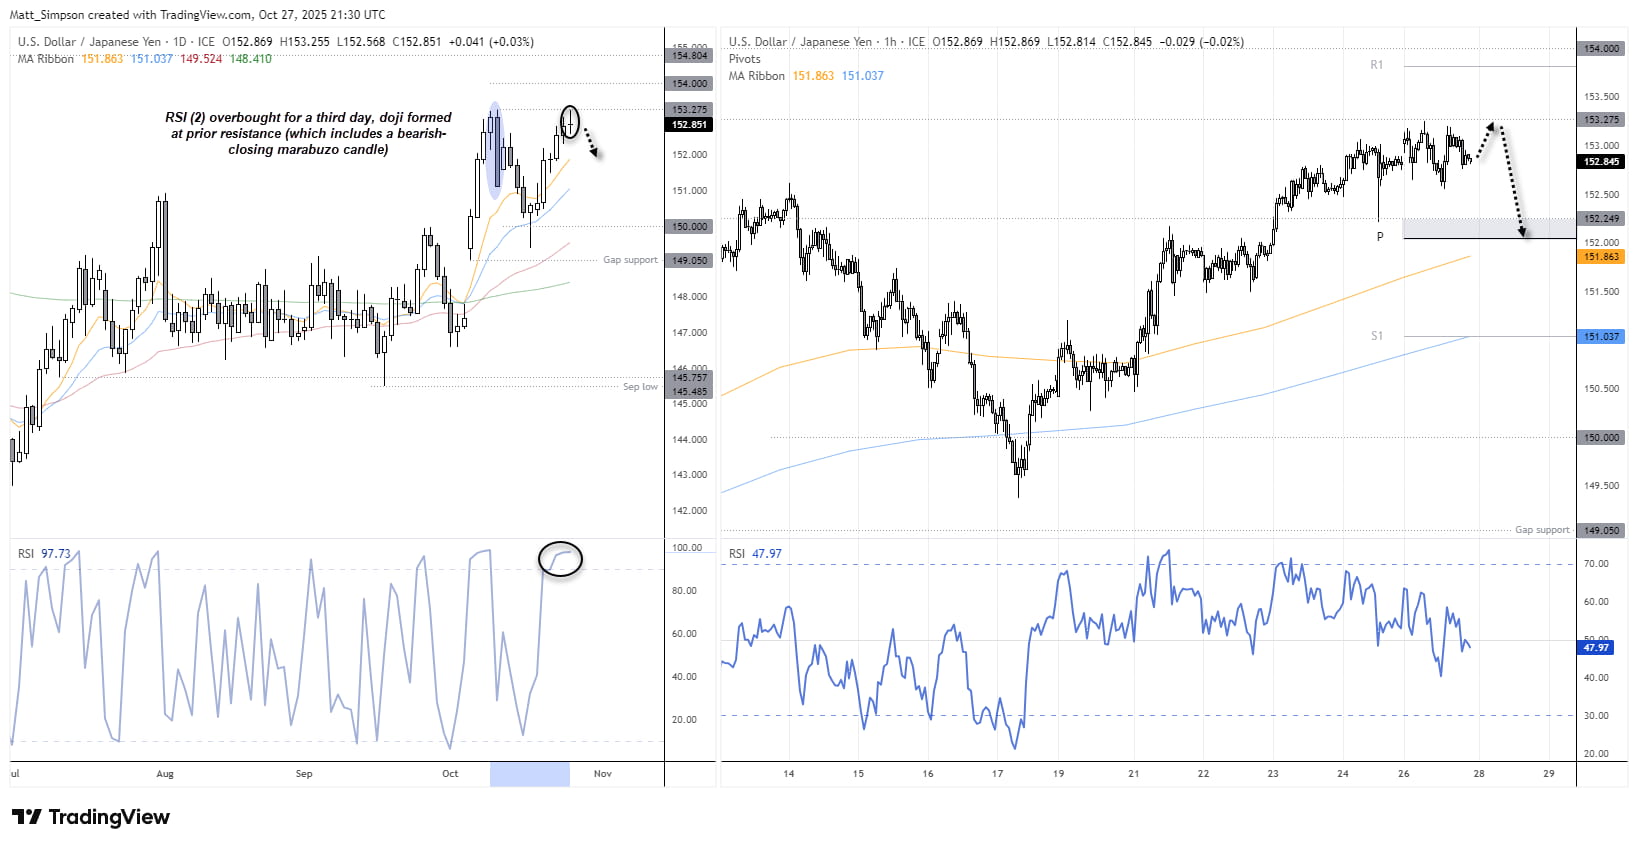
Chart analysis by Matt Simpson - data source: TradingView USD/JPY
View the full economic calendar
View the full economic calendar
-- Written by Matt Simpson
Follow Matt on Twitter @cLeverEdge
How to trade with City Index
You can trade with City Index by following these four easy steps:
- Open an account, or log in if you’re already a customer
• Open an account in the UK
• Open an account in Australia
• Open an account in Singapore
- Search for the market you want to trade in our award-winning platform
- Choose your position and size, and your stop and limit levels
- Place the trade
Related tags:
Latest market news




Open an account in minutes
Experience award-winning platforms with fast and secure execution, and enjoy tight spreads from 0.5 pts on FX and 0.3 pts on indices.
Economic calendar
Web Trader platform
Our sophisticated web-based platform is packed with features.
Related articles
USD Exhaustion into Bearish Engulf: EUR/USD, GBP/USD, USD/JPY
It was a big week for the Dollar with stronger inflation pushing rate hike themes, with price action diverging as price printed a bearish engulf on the weekly DXY chart.
Swiss Franc Forecast: USD/CHF Seven-Week Rally Reverses From Yearly Highs 10 16 2026
A sharp rejection from fresh highs has shifted momentum in favor of USD/CHF bears, raising the stakes for a critical support test.


AUD/USD Bulls Fight Back After Australian Jobs Shock
AUD/USD has been hit by another ugly Australian employment report, sending RBA rate hike expectations sharply lower. Yet the relationships driving the currency have shifted since quarter-end, and improving risk appetite could provide the fuel for a recovery.

This report is intended for general circulation only. It should not be construed as a recommendation, or an offer (or solicitation of an offer) to buy or sell any financial products. The information provided does not take into account your specific investment objectives, financial situation or particular needs. Before you act on any recommendation that may be contained in this report, independent advice ought to be sought from a financial adviser regarding the suitability of the investment product, taking into account your specific investment objectives, financial situation or particular needs.
StoneX Financial Pte. Ltd., may distribute reports produced by its respective foreign entities or affiliates within the StoneX group of companies or third parties pursuant to an arrangement under Regulation 32C of the Financial Advisers Regulations. Where the report is distributed to a person in Singapore who is not an accredited investor, expert investor or an institutional investor (as defined in the Securities Futures Act), StoneX Financial Pte. Ltd. accepts legal responsibility to such persons for the contents of the report only to the extent required by law. Singapore recipients should contact StoneX Financial Pte. Ltd. at 6826 9988 for matters arising from, or in connection with the report.
In the case of all other recipients of this report, to the extent permitted by applicable laws and regulations neither StoneX Financial Pte. Ltd. nor its associated companies will be responsible or liable for any loss or damage incurred arising out of, or in connection with, any use of the information contained in this report and all such liability is hereby expressly disclaimed. No representation or warranty is made, express or implied, that the content of this report is complete or accurate.
StoneX Financial Pte. Ltd. is not under any obligation to update this report.
Trading CFDs carries a high level of risk that may not be suitable for some investors. Consider your investment objectives, level of experience, financial resources, risk appetite and other relevant circumstances carefully. The possibility exists that you could lose some or all of your investments, including your initial deposits. If in doubt, please seek independent expert advice. Visit www.forex.com/en-sg/terms-and-policies for the complete Risk Disclosure Statement.