
Over the past five trading sessions, Bitcoin price action has maintained a consistent bullish bias, allowing the cryptocurrency to post a recovery of nearly 4% during this period. Buying pressure has begun to re-emerge in the BTC market, driven by a rebound in institutional interest, which has supported more stable short-term demand, partly linked to the start-of-year effect. As long as this behavior persists, buying pressure is likely to remain a key feature in BTC price movements over the coming trading sessions.

New Capital Flows Begin to Enter the BTC Market
With the start of the new year, institutional confidence in Bitcoin appears to be recovering. This is reflected in the behavior of net flows into Bitcoin ETFs, which, according to the latest available data, recorded a positive inflow of $471 million on January 2, 2026. Inflows of this magnitude had not been seen since December 17, 2025, and they mark a break from the streak of capital outflows that characterized the institutional BTC market during the final weeks of last year. This move suggests that a new phase of risk appetite is beginning to take hold in the short term.
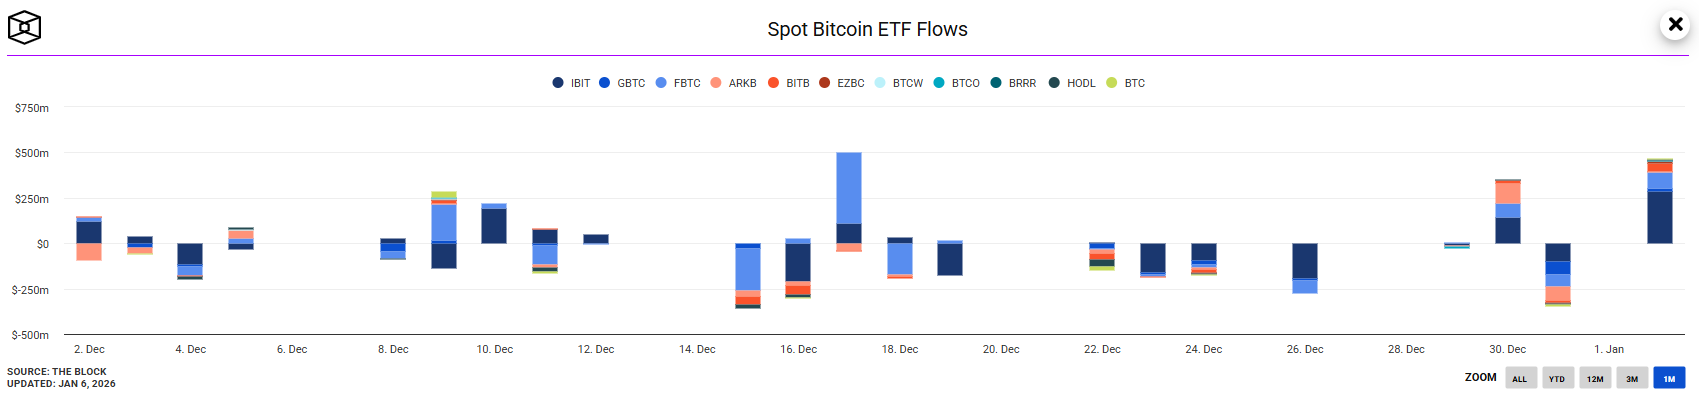
Source: Theblock
This behavior can be partially explained by typical start-of-year flows, associated with portfolio rebalancing processes following the close of 2025. In the absence of a significant financial stress scenario that would drive strong demand for safe-haven assets, institutional participants may be resuming exposure to higher-risk assets, such as Bitcoin. This shift in perspective appears to be supporting a gradual reintegration of BTC into institutional portfolios, reinforcing its appeal relative to traditional markets.
In this context, the sustained growth in ETF inflows could be signaling a change in market perception after several weeks of neutrality and low price volatility. If this trend continues, it could pave the way for a more clearly defined bullish bias, leaving behind the selling pressure that dominated the final months of 2025 and opening the door to a stronger demand environment in the sessions ahead.
Is Confidence Growing?
During recent sessions, the Crypto Fear & Greed Index has shown a notable recovery, moving back toward the “greed” zone, with readings around 49 points, levels not seen since October 2025. This behavior reflects a short-term improvement in market confidence.
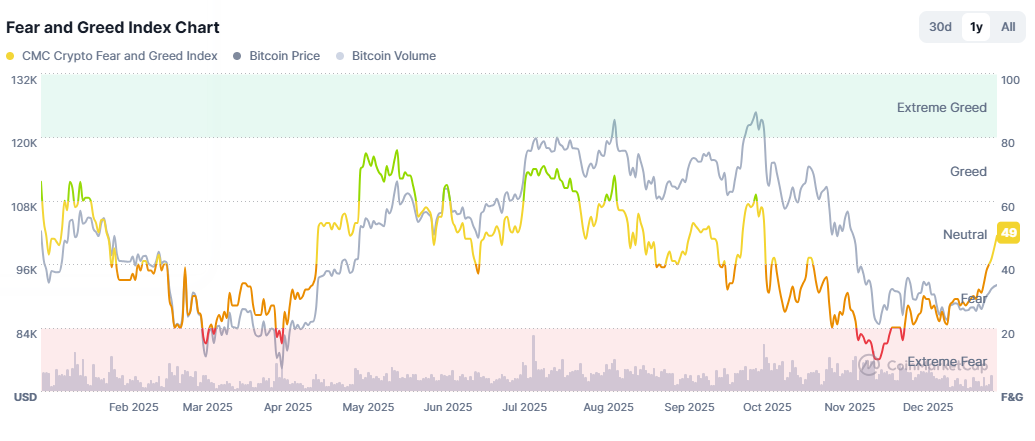
Source: Coinmarketcap
The sustained increase in confidence levels suggests that the market may be laying the groundwork for more consistent demand in BTC. If the index continues to move further into the “greed” zone, it could confirm stronger underlying demand, which in turn may continue to support sustained buying pressure in the coming trading sessions.
Bitcoin Technical Outlook

Source: StoneX, Tradingview
- The bullish move begins to gain traction: Since the start of 2026, BTC price action has displayed a meaningful bullish bias, strong enough to break the bearish trendline that had dominated the final months of 2025. However, despite the strength of the move, it has not yet been sufficient to break the sideways range that has developed in recent weeks, defined by resistance near $92,000 and support around $85,000. Until a clear breakout from this range occurs, confirming the formation of a dominant bullish trend may remain challenging in the short term.
- RSI: The RSI continues to trade above the neutral 50 level, indicating that buying momentum remains dominant over the average of the past 14 sessions. If the indicator maintains an upward slope, it could further reinforce bullish pressure in BTC price action in the short term.
- TRIX: The TRIX indicator shows a stable positive slope, gradually approaching the neutral zero line. This behavior suggests that selling pressure is weakening and that the market is entering a transition phase. A sustained move above zero could confirm a clearer dominance of buying momentum, reinforcing the view of an emerging bullish bias on the chart.
Key Levels:
- 92,956 – Key resistance: A zone of recent highs that aligns with the upper boundary of the sideways range. Buying pressure that manages to consolidate above this level could pave the way for the formation of a dominant short-term bullish trend.
- 89,235 – Nearby barrier: A support zone aligned with the 50-period simple moving average. As long as price remains near this level, the sideways range may continue to dominate BTC price behavior.
- 85,652 – Major support: A zone marking the lows of recent months and the most relevant downside barrier to monitor. A move back toward this level could reactivate the bearish trendline that dominated much of 2025 and bring renewed focus to a bearish bias.
Written by Julian Pineda, CFA, CMT – Market Analyst
Follow him on: @julianpineda25