



In yesterday’s webinar I shared my continued affinity for GBP-strength for scenarios of USD-weakness. There was a big spot of support that has come into play that’s since run into resistance and tomorrow’s Bank of England rate decision will likely play a role here, although, paradoxically, it’s the Japanese Yen that may have a larger input on the matter, which I’ll explain further below.
In GBP/USD, we’re in between the nexus of two long-term trendlines. The longer-term trendline connects the 2022 high to the 2025 swing highs, the projection of which was in-play just last week. Bears couldn’t contain the pressure as the USD got a bearish push when President Trump remarked that he though the currency’s weakness was ‘great.’
On a shorter-term basis, there’s a trendline connecting last year’s swing highs that’s since come in as support that we’ll take a closer look at in a moment.
GBP/USD Weekly Chart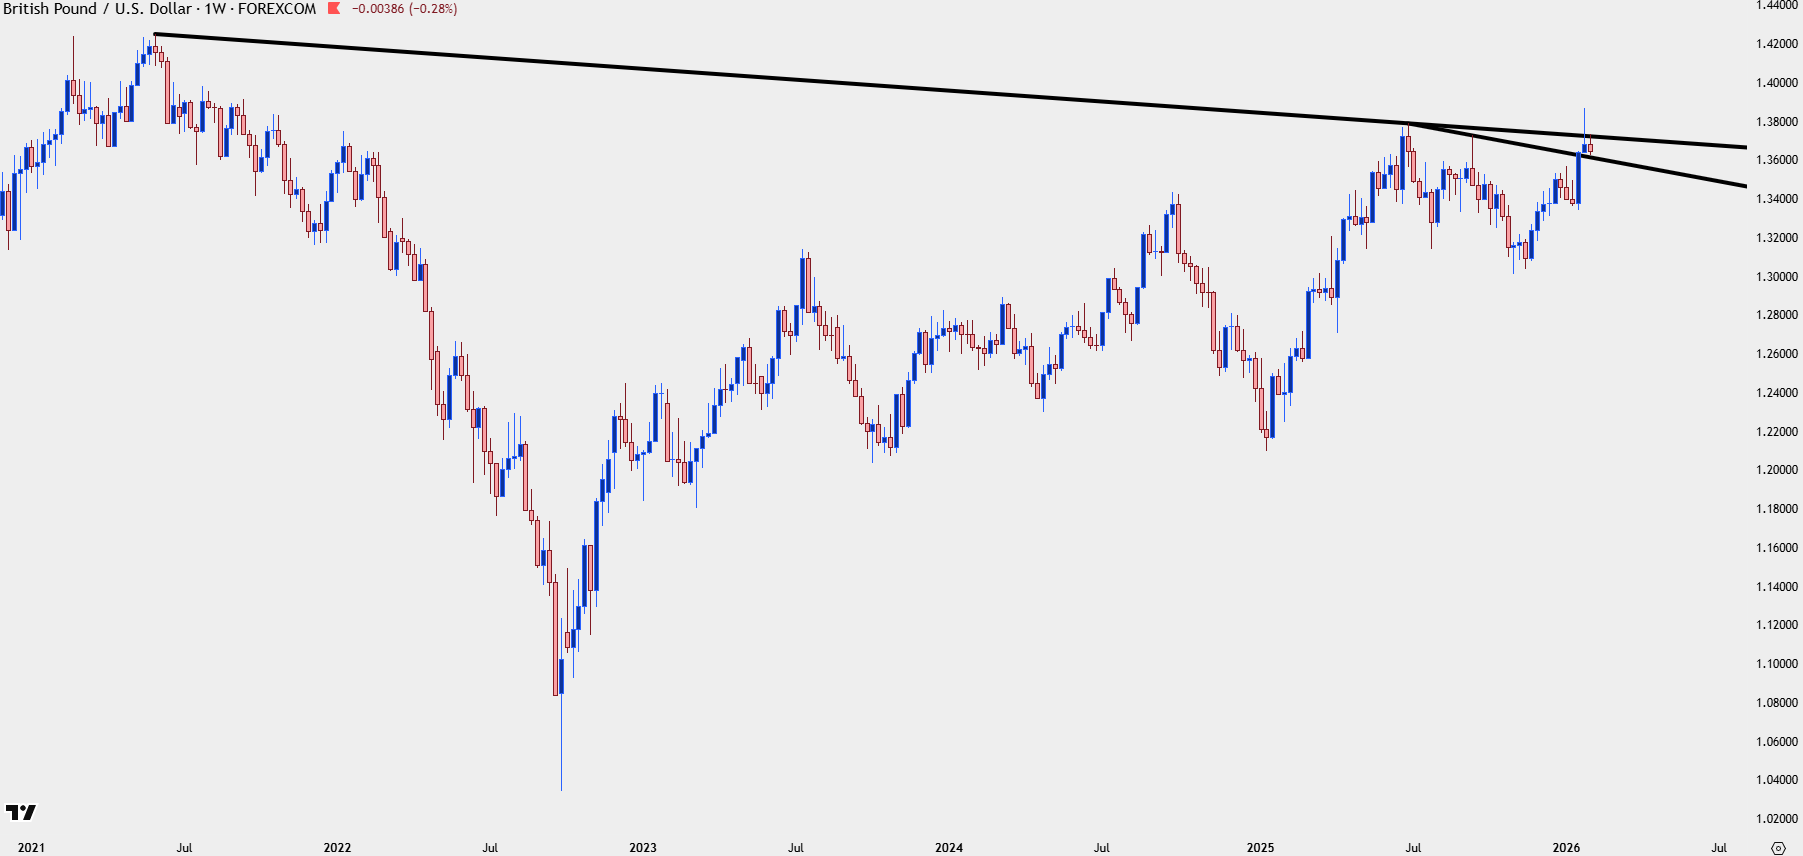
Chart prepared by James Stanley; data derived from Tradingview
GBP/USD Shorter-Term
In yesterday’s webinar I looked at a resistance level at 1.3768, which is simply a swing-high from last September, right around when the Fed started cutting rates. That price has since come in, along with the longer-term trendline projection, to hold today’s high and as of now the daily bar is showing as a bearish engulfing candlestick.
Those are difficult formations because there’s both a wide distance for risk placement but also an undeniable tonality change. With a BoE meeting tomorrow the range of possible scenarios opens but I think one of the more proactive ways to work with something like this, particularly if we close with a confirmed bearish engulf on the daily, is to look for initial continuation down for a deeper support test.
This sets up 1.3623 as a ‘s1’ support with the prior point of resistance at 1.3568 as an ‘s2.’ And for ‘s3’ I’m looking to the familiar 1.3500 psychological level.
With that said, there may be greener pastures elsewhere for Sterling strength, which I’ll look at below with GBP/JPY.
GBP/USD Daily Chart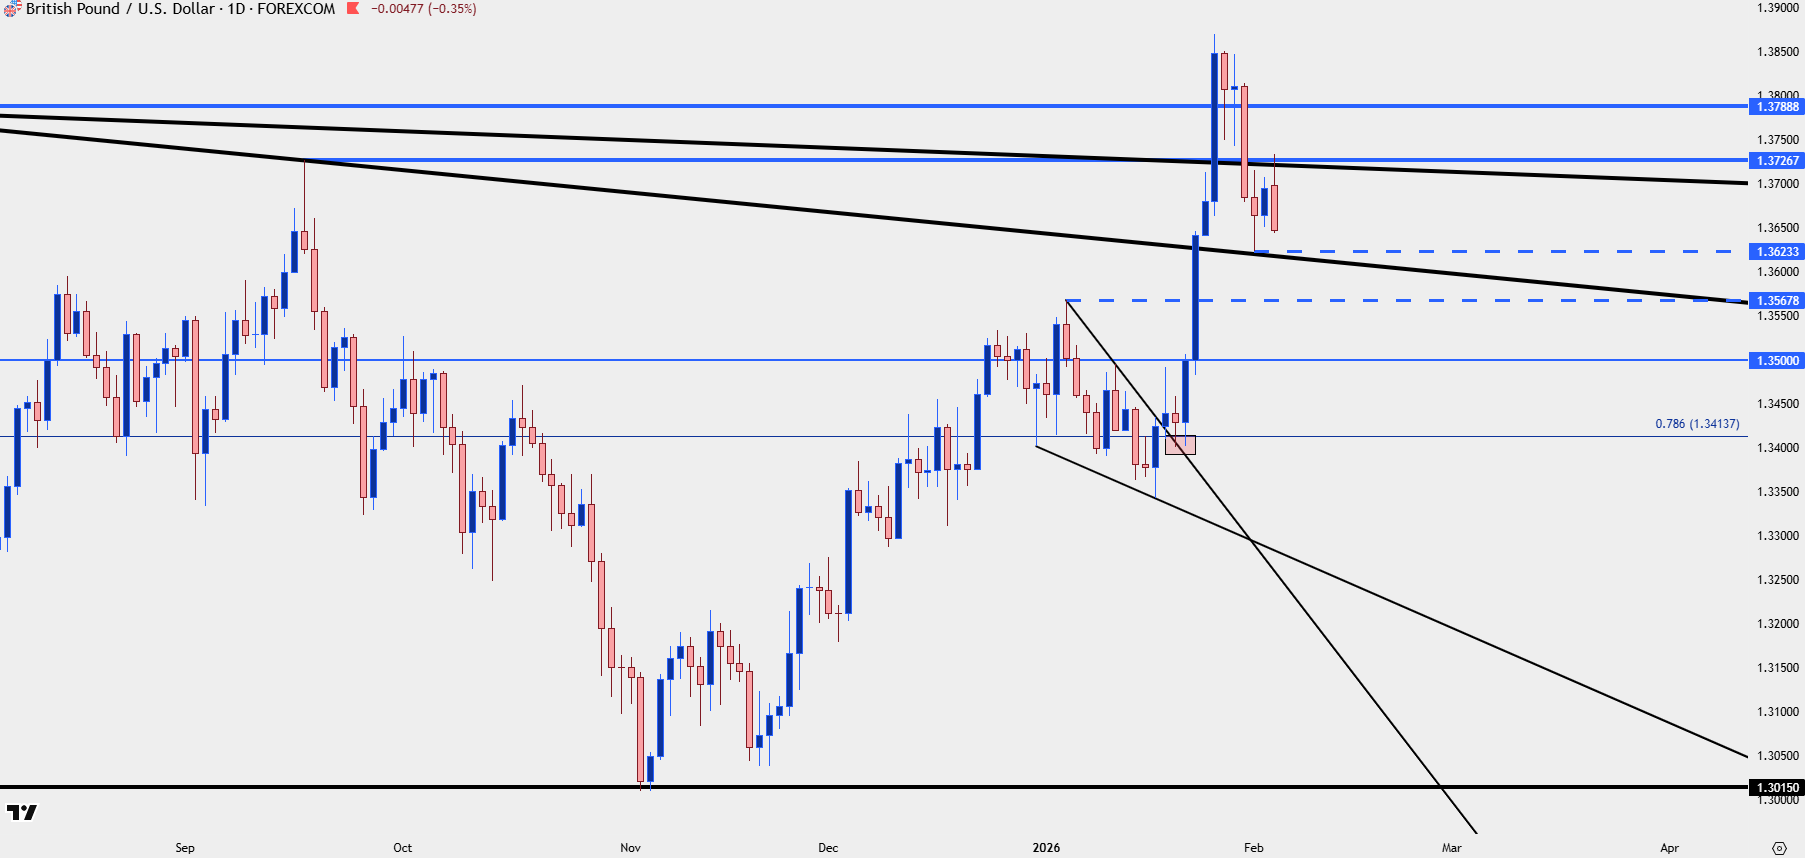
Chart prepared by James Stanley; data derived from Tradingview
GBP/JPY
Earlier I commented that the Japanese Yen may have more impact on GBP flows against the US Dollar than the Bank of England rate decision, which understandably might sound confusing. But one just needs to look at what happened two weeks ago when USD/JPY snapped for illustration of what I’m referring to, and the reason this happens is because of how powerful major pairs can be in comparison to cross pairs.
With a heavy one-sided position still holding on in USD/JPY, if we see reversion and USD-weakness against JPY-strength, that USD-weakness can certainly show elsewhere, as can JPY-strength. This is why both EUR/JPY and GBP/JPY got hit so hard two weeks ago, and it’s also why EUR/USD and GBP/USD rallied against the US Dollar back in Q3 of 2024 when the initial repercussions of carry unwind began to show.
In response to those sell-offs I continued to draw attention to the technical structure of GBP/JPY, which saw four consecutive days of support holding at the 210.00 level. If you want a further explanation behind these setups I went in-depth in webinars two weeks ago and then again yesterday, and since, GBP/JPY has pushed up for a fresh 18-year high.
GBP/JPY Daily Chart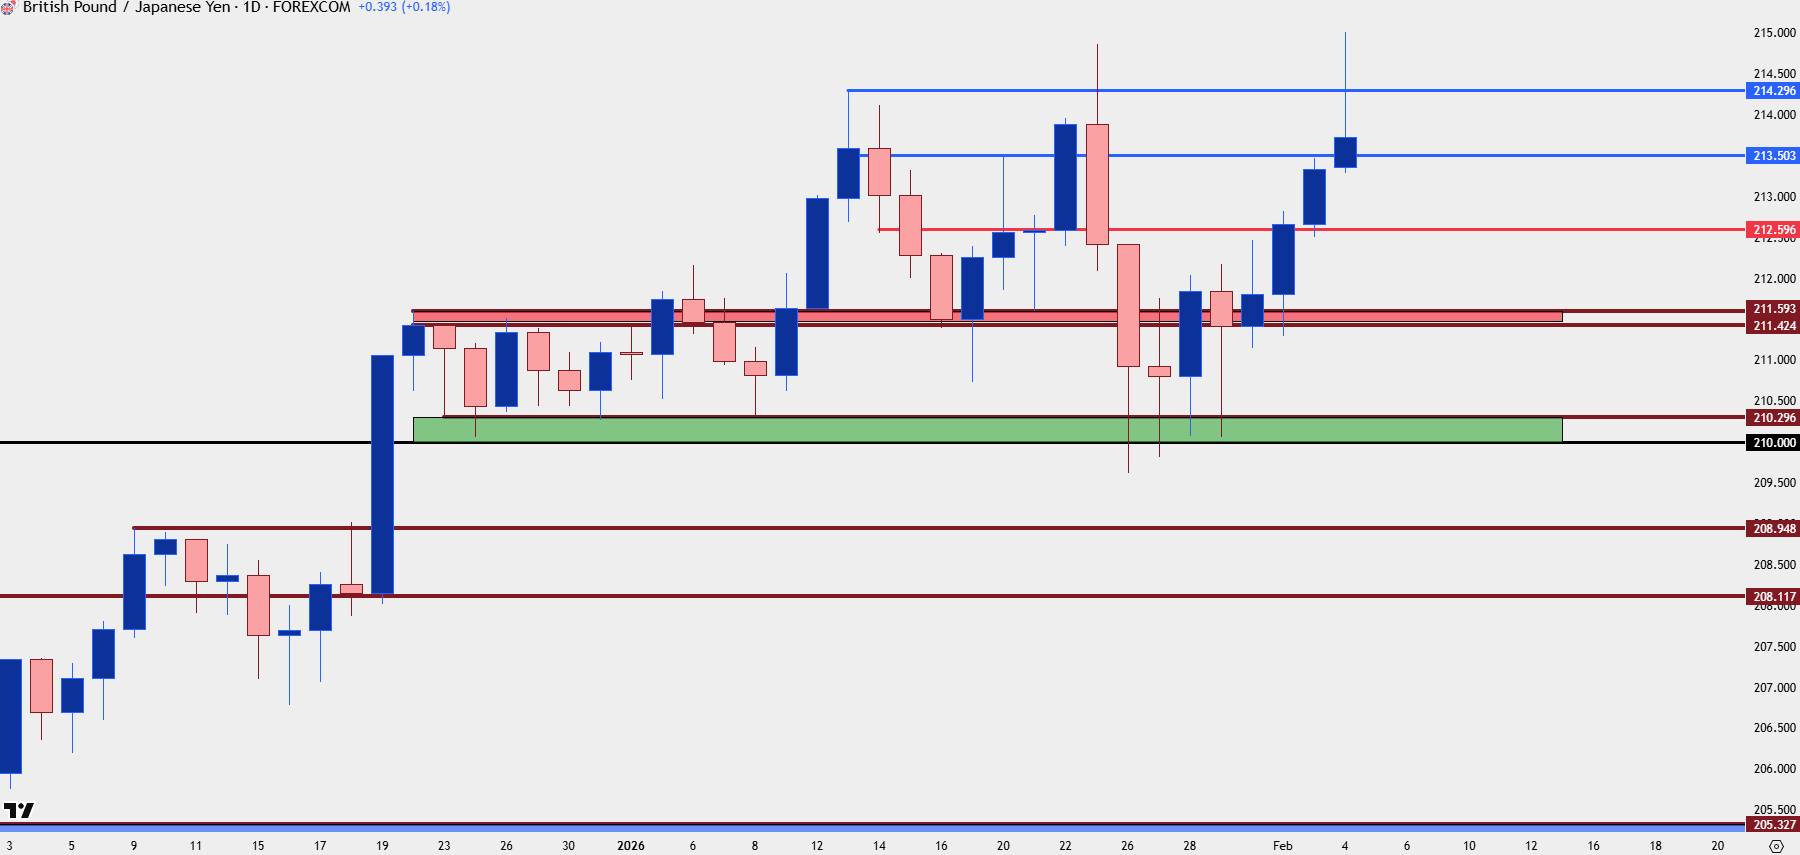
Chart prepared by James Stanley; data derived from Tradingview
GBP/JPY Structure
After the fresh high in GBP/JPY we now have some squaring up ahead of the Bank of England tomorrow and given adherence to prior structure, there’s a few zones of interest to look for support. The first is already nearby at 213.50 and that’s followed by 212.60. Below that is a key area at 211.42-211.59 and this is a prior spot of resistance from a previous range and ideally that’s what buyers would defend before allowing for another test of the contentious 210.00 zone. Hope isn’t necessarily lost on the long side if that 210 zone comes into play but a reversal of that size would suggest something else might be brewing and at this point I’d expect that to be coming from the Japanese Yen, but regardless, it would be a situation worthy of further review if that scenario comes into play.
GBP/JPY Four-Hour Chart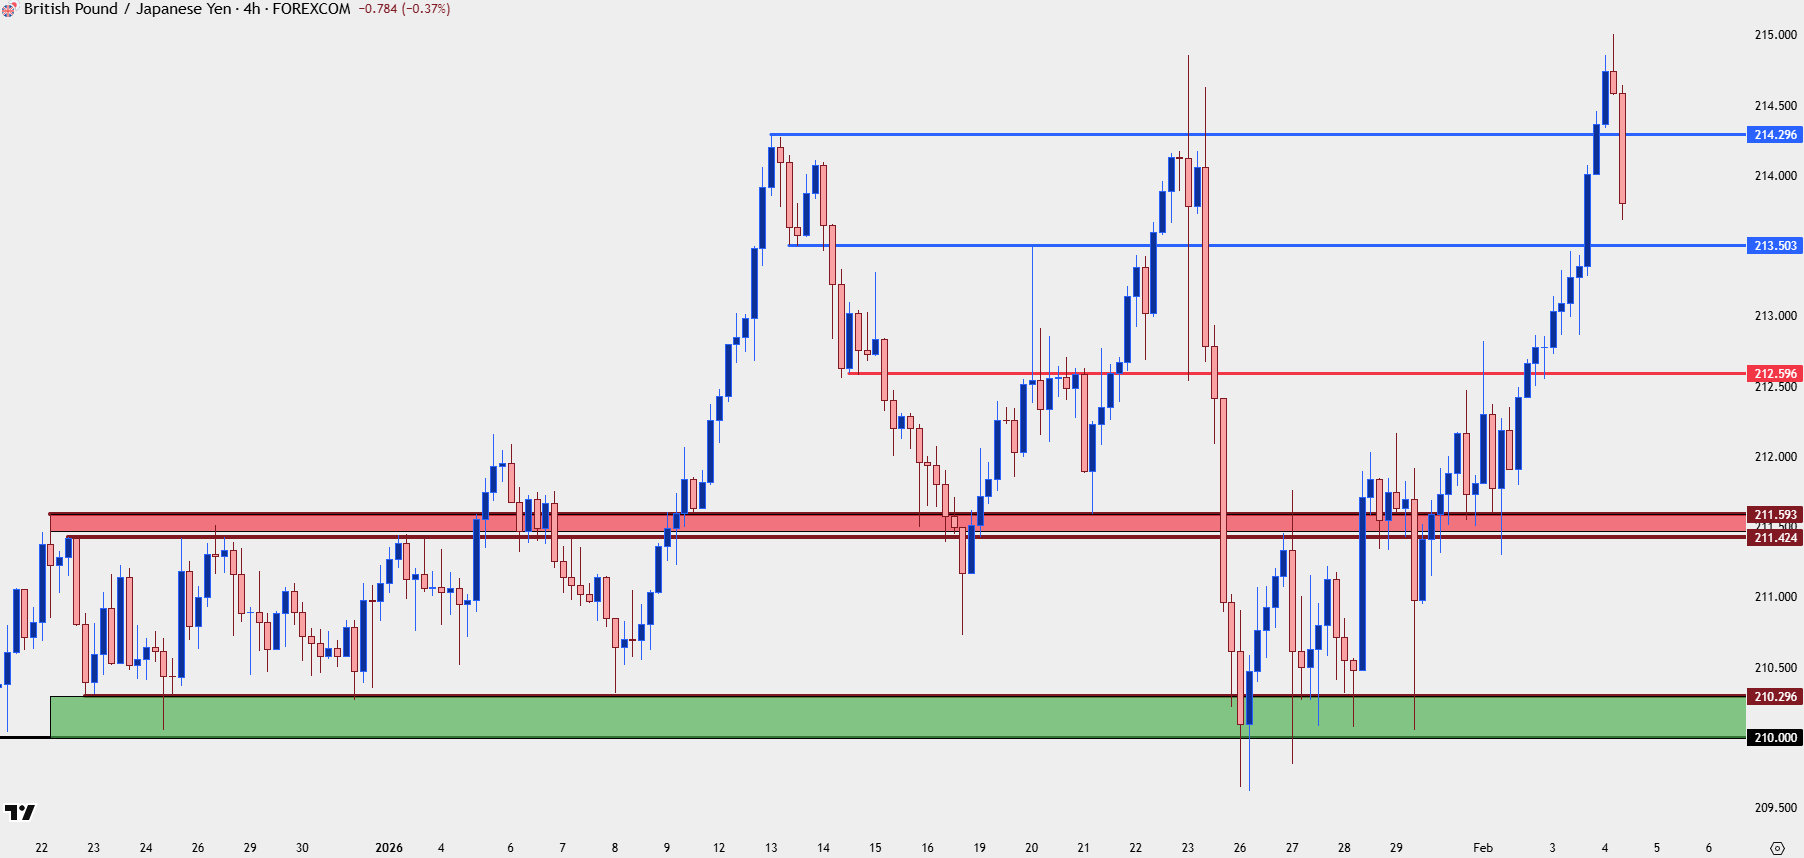
Chart prepared by James Stanley; data derived from Tradingview
--- written by James Stanley, Senior Market Analyst, Global Macro






