
Well, so far there’s been a lot of familiarity. Coming into the week it was the same 4850 resistance level that gold has tested thrice and that buyers weren’t able to push above. That resistance led to the build of a rising wedge, and that began to break down on Tuesday with the Fibonacci level of 4671 coming into play just before Trump extended the ceasefire deadline which led to a bounce.
That bounce was short-lived, however, as prices rallied up to resistance at prior support, and sellers have taken another shot, only to be rebuked at the same 4671 Fibonacci level so far today.
Gold Four-Hour Chart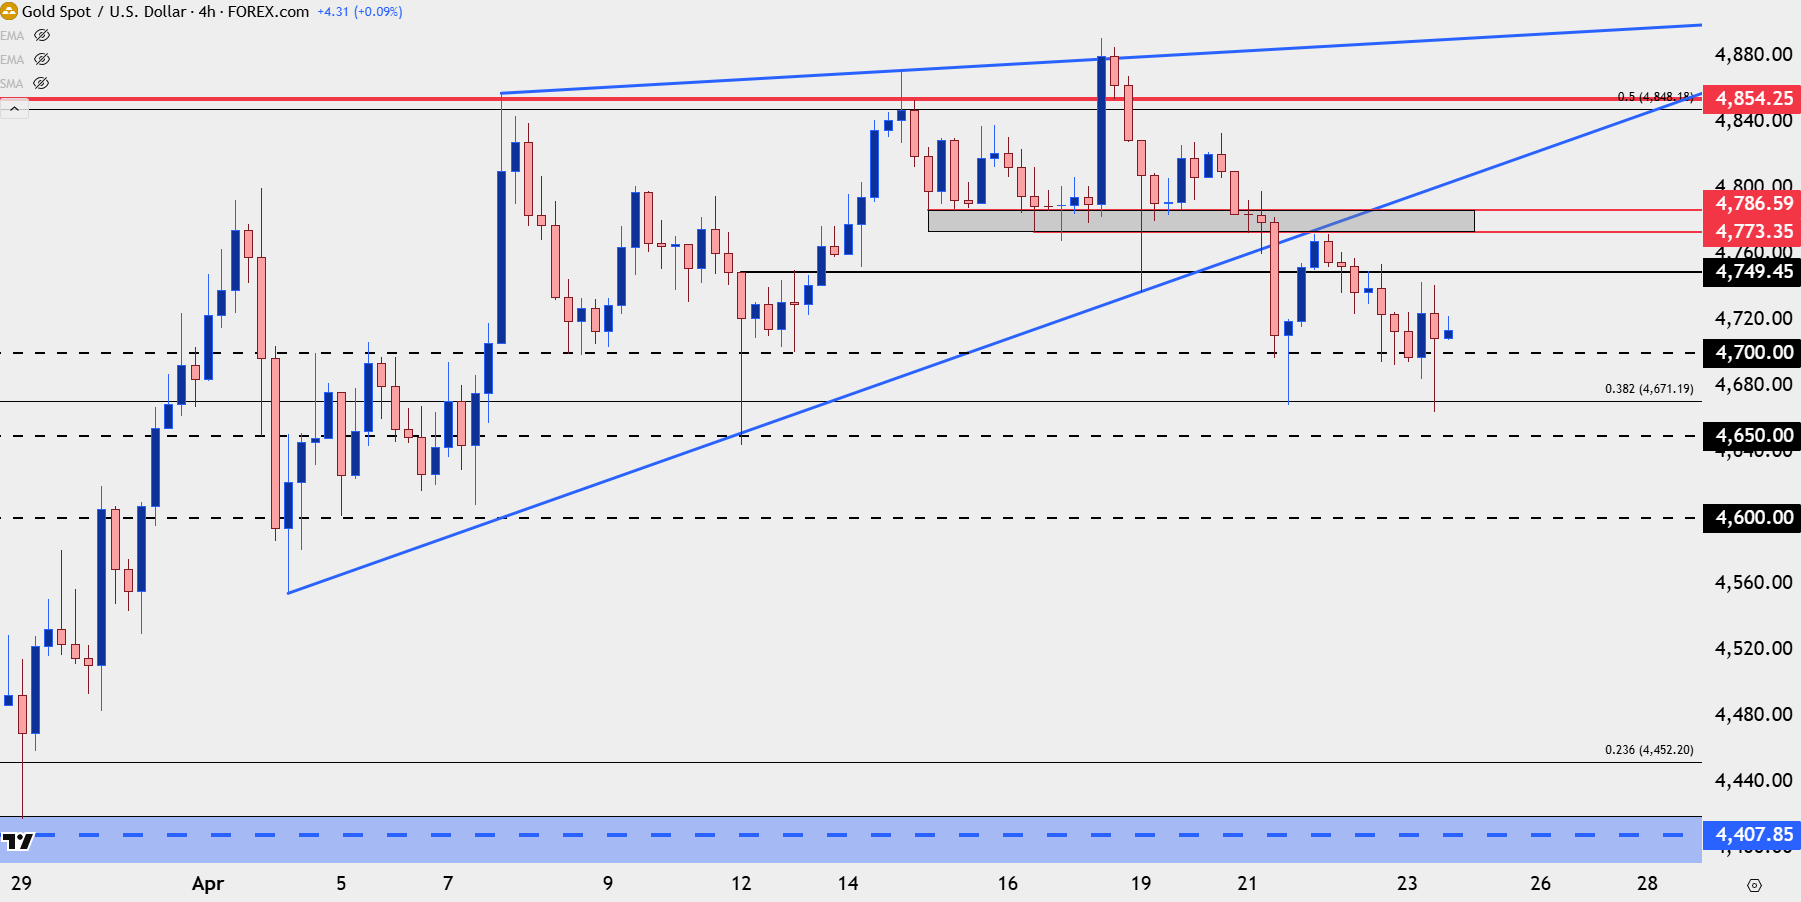
Chart prepared by James Stanley; data derived from Tradingview
Gold Bigger Picture
From the weekly chart in gold it appears that we’re still within that consolidating framework after the $1500 range that set from the January highs to the March lows, and the 4850 level is the mid-point of that move. It’s also a spot of prior support so the fact that buyers haven’t yet been able to stage a rally above suggests that we could be in for continued consolidation. And given the drivers, and prior instances of a similar nature in gold such as last year’s four month-build of a bull pennant that resolved in August when Powell opened the door to more rate cuts, it makes logical sense.
What could ultimately spur the rally into fresh highs would be a dovish Fed and for that, we’d likely need some softness on the inflation front. And with a war continuing to brew in the Middle East that’s a difficult concept to price in at this point.
Gold Weekly Chart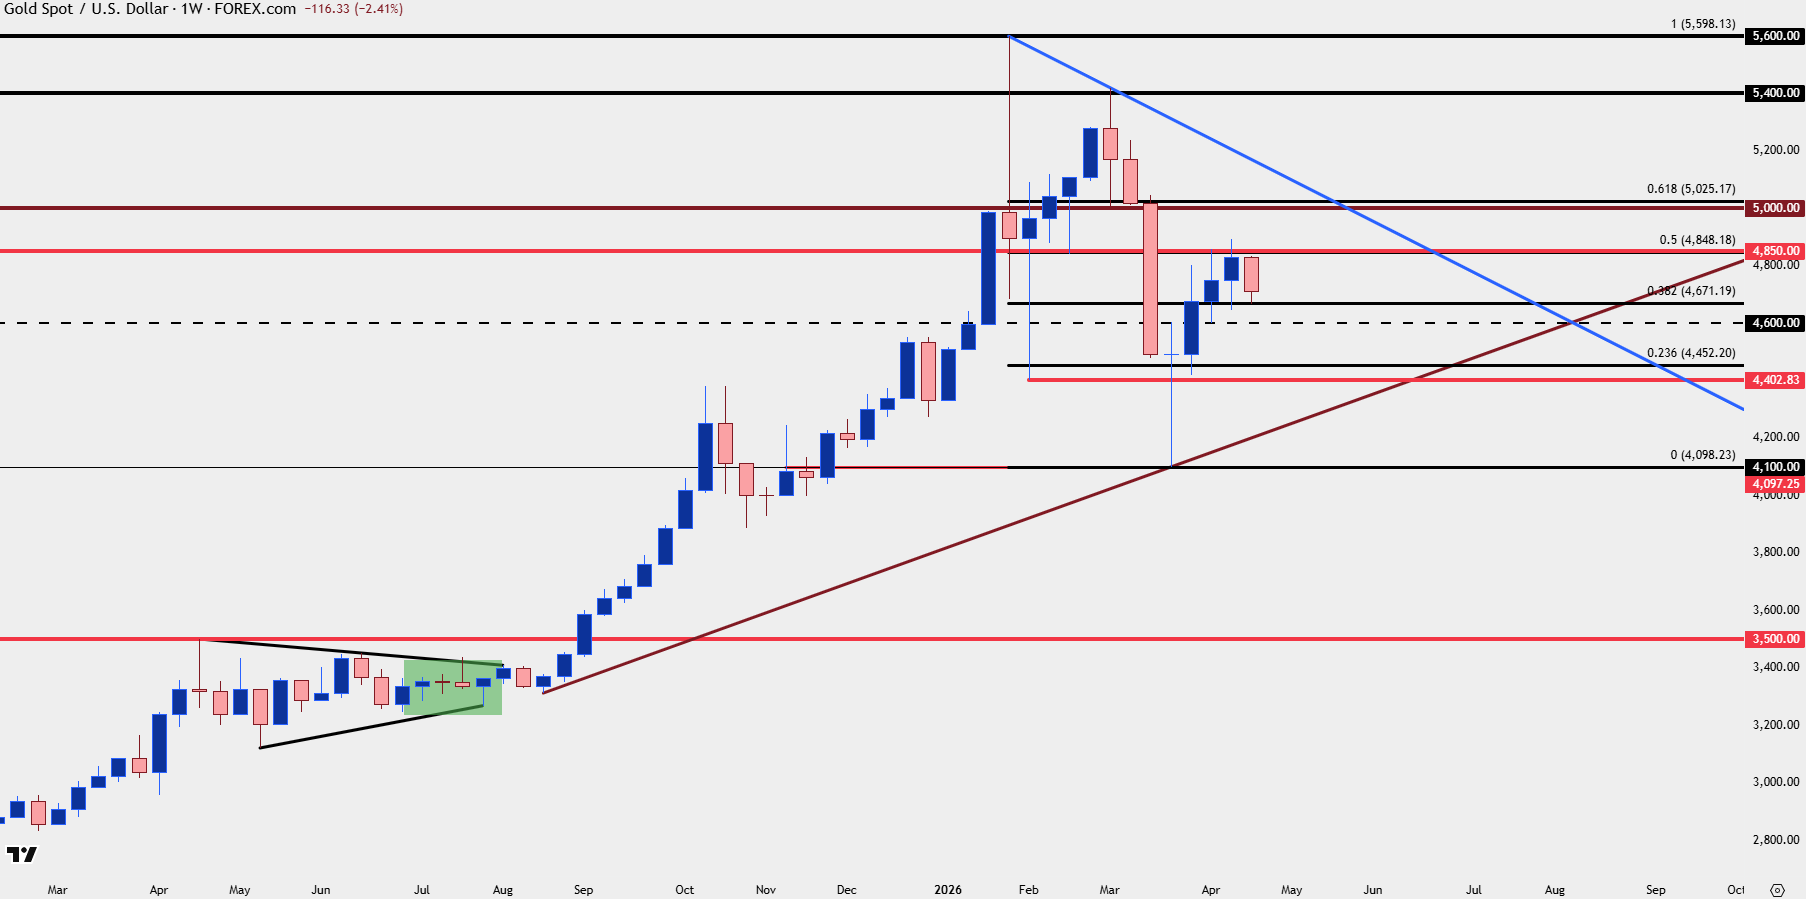
Chart prepared by James Stanley; data derived from Tradingview
--- written by James Stanley, Senior Market Analyst, Global Macro