SPX, NDX Snap Back From ATH
April now seems so long ago and in equities the rally from those lows was intense, with the Nasdaq 100 gaining a whopping 58% in a little more than six months while the S&P 500 jumped by 43%. The mood has shifted since the Fed’s last rate cut, however, with both indices dropping and failing to fill gaps from the open, bringing with it a healthy dose of fear as the CNN Fear and Greed Index has moved back into ‘Extreme Fear’ territory despite the S&P 500 being less than 3% off of all-time-highs.

When you grow accustomed to smooth sailing even the slightest bumps can cause disruption, and that seems to be what’s ailing equity markets at the moment. The backdrop since the Fed’s rate cut last week hasn’t been the ‘up and to the right’ movement that stock markets have enjoyed since the April turn on tariffs from President Trump, and that’s caused for a move back into ‘extreme fear’ territory in the CNN Fear and Greed Index, which is a barometer of investor sentiment.
CNN Fear & Greed Index: Extreme Fear After 3% Pullback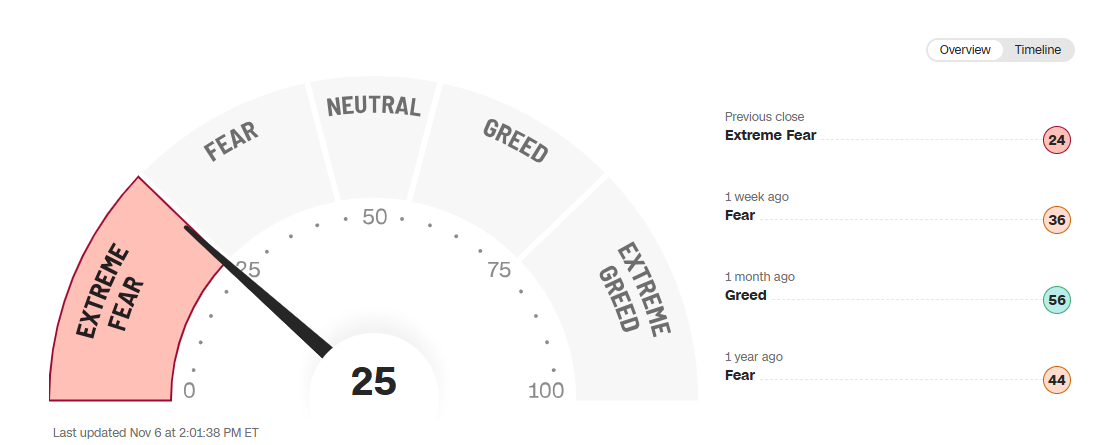
Data taken from CNN Fear and Greed Index
To be sure, the rallies are and have been quite stretched, following the Nasdaq 100’s massive 58% swing to go along with the 43% jump in the S&P 500. But, pullbacks can be opportunistic until there’s greater evidence of larger reversal, and that’s largely where we’re at currently.
With this morning’s fall the S&P 500 has now filled the gap from October 24th, which showed up just ahead of the last FOMC meeting. The excitement at the time was evident as the next week opened with a sizable gap and that happened again on the Tuesday before the announcement.
SPX Daily Chart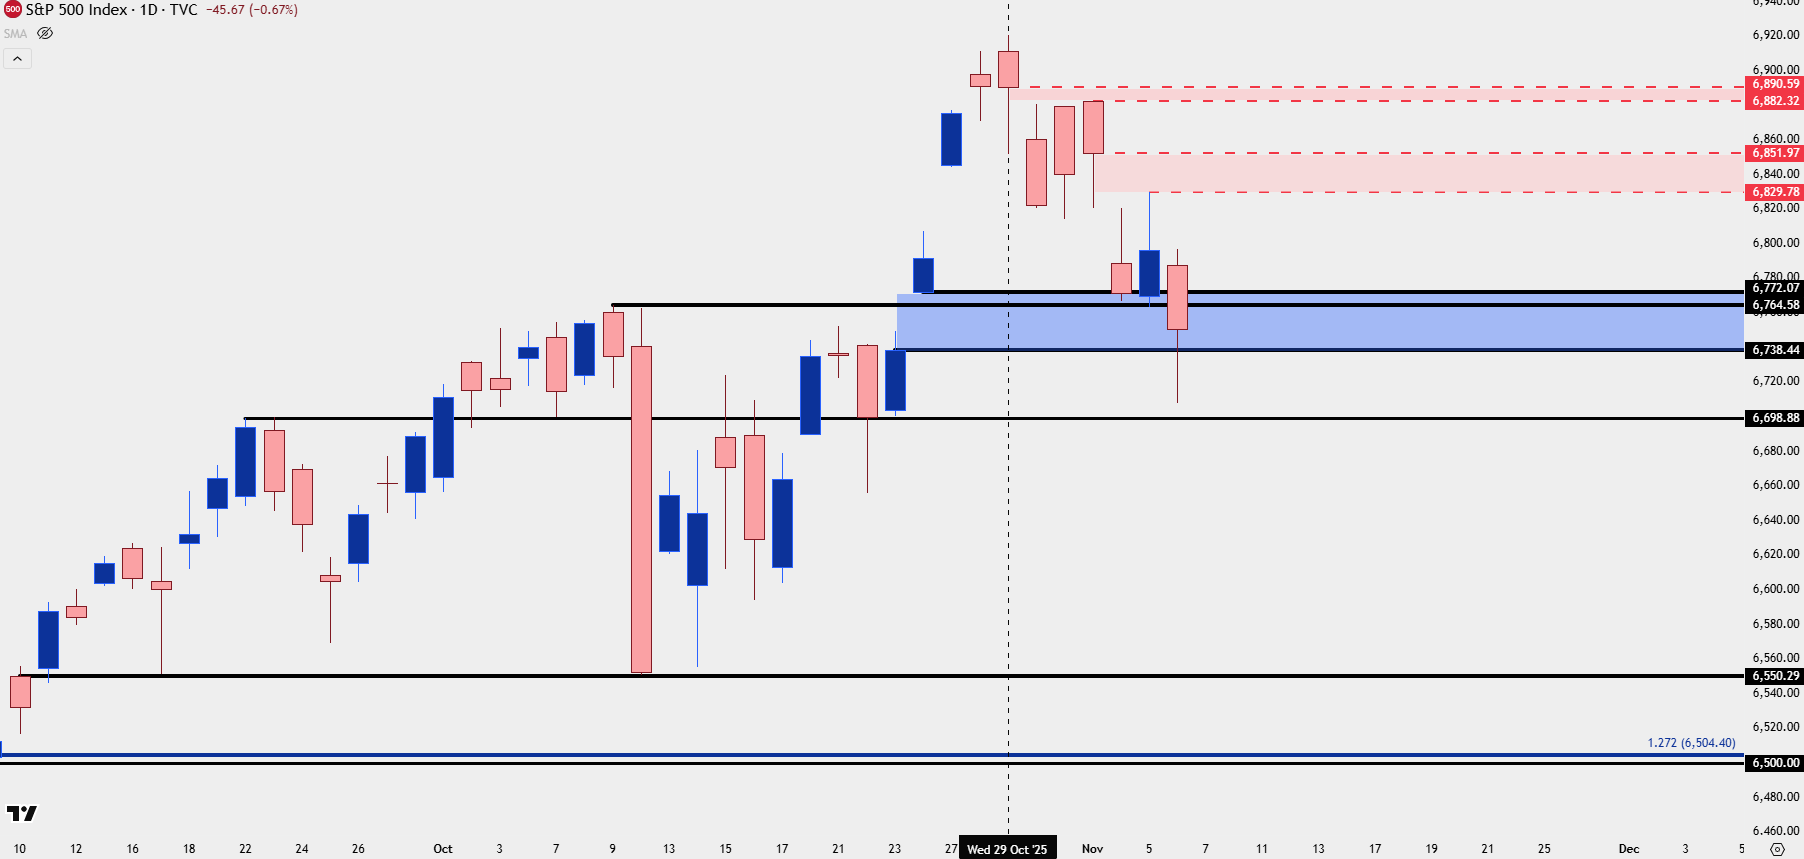
Chart prepared by James Stanley; data derived from Tradingview
For that larger reversal or pullback potential, we’ve had a couple of items crop up. On Friday October 10th, President Trump threatened larger tariffs on China. This caused a spasm in equities that saw the S&P 500 close at the lows for the week, which also happened to be a big spot of support at 6550. Over that weekend, Trump softened his tone and equities gapped-higher on the following Monday, but it was the pullback that Thursday that held a low above that prior support swing that started to launch prices-higher. This could perhaps prove illustrative for strategy in the days and weeks ahead.
What made the March-April sell-off so intense was the fact that neither Trump nor Powell seemed all too interested in trying to turn things around. Trump continued to push the tariff narrative, even as stocks were falling; and Jerome Powell continued to say that the fear of inflation from tariffs was too great to start talking about rate cuts. What he seemingly left out was that the prior year’s rate cuts had helped to fuel inflation again so there was probably also the fear that inflation wasn’t yet tamed, although it was the tariffs that were the big talking point at the moment.
Trump’s turn in early-April was a launching pad for the rallies, and then through the summer, odds built for the Fed to cut rates again which helped to extend those moves. The big change over the past week was that Powell didn’t seem all too convinced that another rate cut would be arriving in December and as you can see from the weekly chart below, last week’s indecision has been followed by a painful looking pullback. This explains why we’re seeing the ‘extreme fear’ readings despite being so close to those recent ATHs.
Around the FOMC, it seems no coincidence that stocks set their current high on the day of the rate cut announcement and have been pulling back ever since, and leaving some opening gaps unfilled along the way. Like we saw from the excitement on the way up into that meeting, with the unfilled bullish gaps, the unfilled bearish gaps show the fear side of the coin versus the greed that was showing previously. At the rate cut, Powell sounded less-dovish than what many were expecting, and he said that December was not a foregone conclusion for a cut.
So, logically, if that dampening of hopes for a December cut has played a role in the sell-off, then the opposite should bring back strength; and if evidence can mount that a December cut is becoming more likely, the door opens for more topside run in stocks.
If we do see a larger pullback develop, there’s still a couple of big areas to look for longer-term support to play out, and as highlighted in the Q4 forecast, that 6500 level is massive as it set resistance at a Fibonacci projection before the breakout in September.
SPX Weekly Chart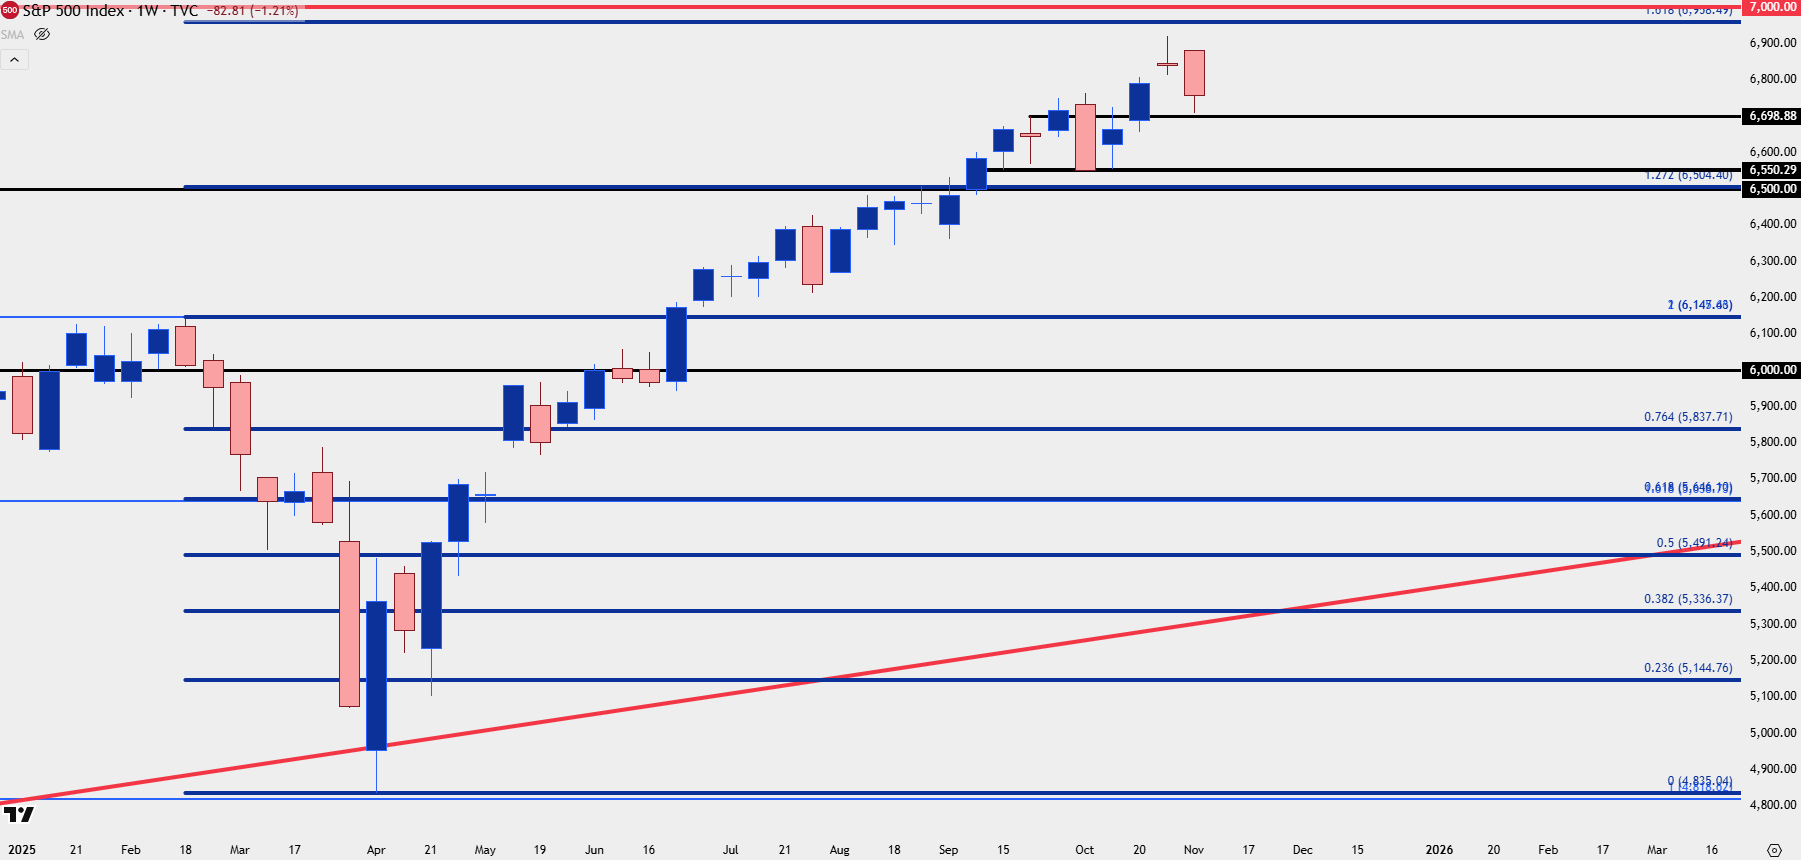
Chart prepared by James Stanley; data derived from Tradingview
The Week-Long Sell-Off
There hasn’t been much for extended sell-offs and bearish sequences in stocks since that April reversal. But at this point we have a string of lower-lows and highs to work with and that can be addressed in a couple of different manners.
For those that do want to take a shot on the short side, there’s resistance potential a little higher, from the prior swing high of 6764 up to 6772. A hold of resistance there on the hourly or four hour chart keeps the door open for downside continuation. Above that, we have some unfilled gap from 6829-6851, and that similarly represents resistance potential, although there could be a bullish take on that as well that I’ll look at in a moment. And above that, we have another unfilled gap from 6882-6890 that represents an ‘r3’ zone of resistance.
For bulls, there’s two ways to move forward. The first would be to wait for a possible momentum shift, looking for that ‘r2’ zone above, the unfilled gap from 6829-6851 to come into play, after which a pull back to and hold of higher-low support in the 6764-6772 zone opens the door for longs. That would then allow for a stretch up to the ‘r3’ zone of 6882-6890, and perhaps even a fresh ATH.
For bears, there may be a more attractive setup in the Nasdaq 100 that I’ll look at below.
SPX Four-Hour Chart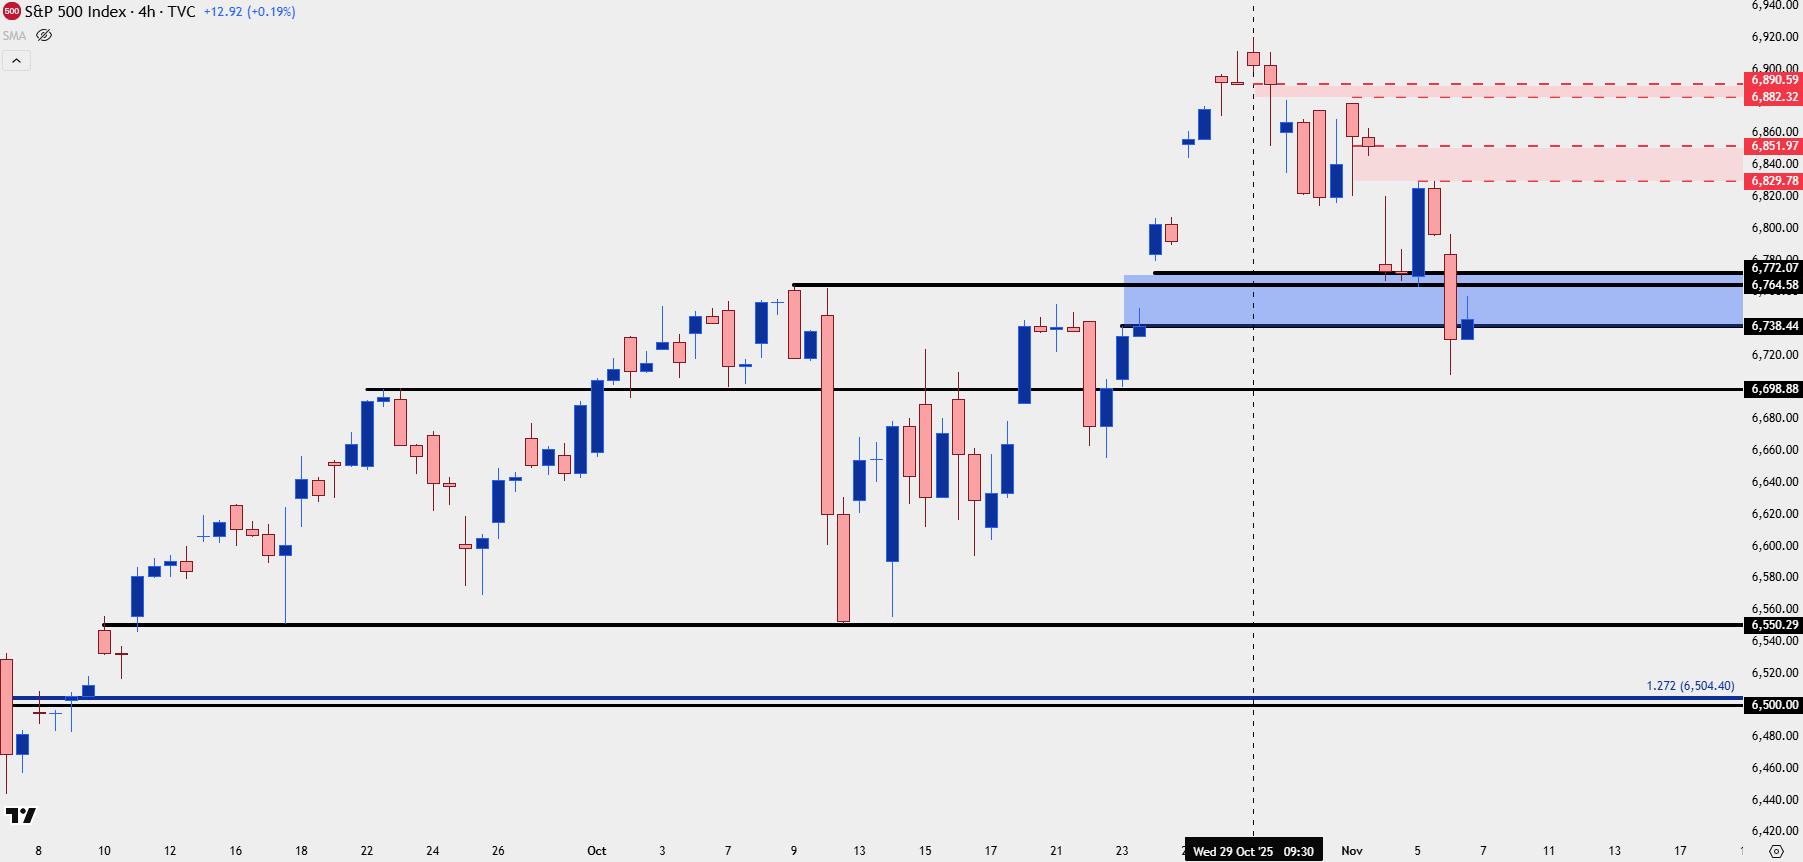
Chart prepared by James Stanley; data derived from Tradingview
Nasdaq 100
A 58% rally is a large move on almost any timeline, but over a roughly seven month period it’s an astounding run. The move has been uneven, however, especially of late, as a rising wedge pattern has built in as bulls have become more and more trepidatious at fresh highs or near resistance. They have remained aggressive near support which is what’s built the more aggressive angle frot the support trendline, but that was tested through earlier this morning as the October 24th gap was filled there, as well.
Nasdaq 100 Daily Chart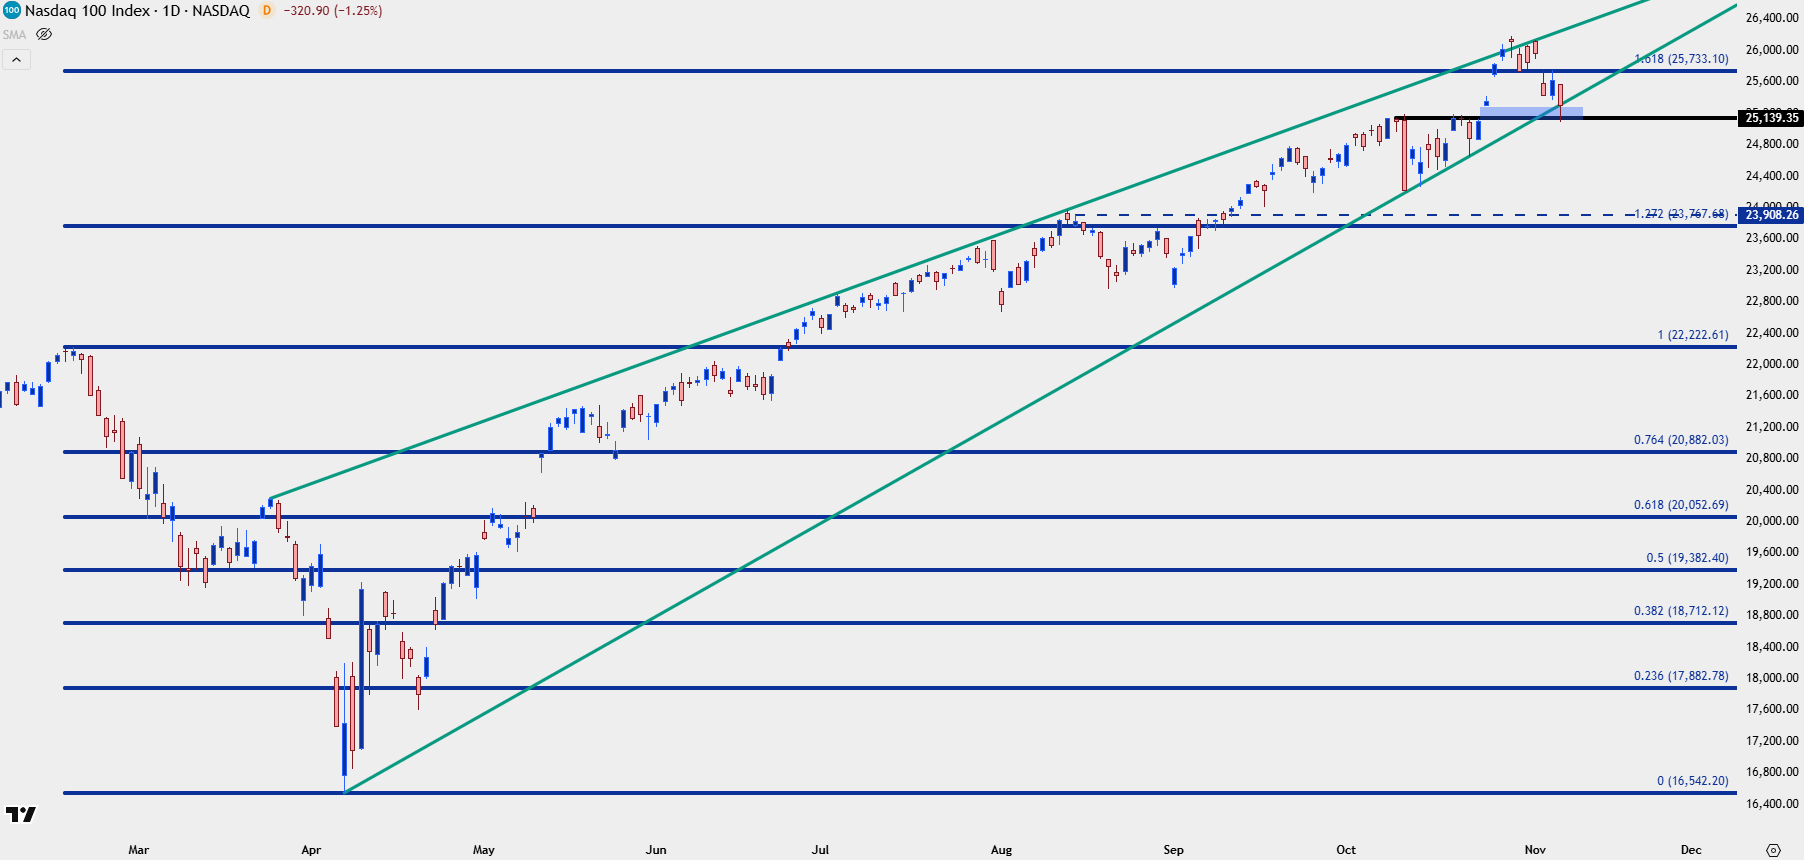
Chart prepared by James Stanley; data derived from Tradingview
Given that greater run-higher in the rally there’s also been a larger pullback, with a peak to trough move of 4.2% in the Nasdaq 100. And if there is a larger sell-off in equities brewing, the tech-heavy Nasdaq could show a larger reaction to that theme as the hot hands that have been driving higher for the past seven months lead into profit taking and larger pullbacks.
For resistance, the 25,364 level is a prior swing low that’s nearby but really it’s the gap from this Tuesday that looms large, and that’s confluent with a Fibonacci extension at 25733, running up to 25972. If sellers are able to spark a larger reversal out of the rising wedge, the big spot of support below the 25k psychological level is the resistance-turned-support that came into play after the October 10th sell-off.
Nasdaq 100 Four-Hour Chart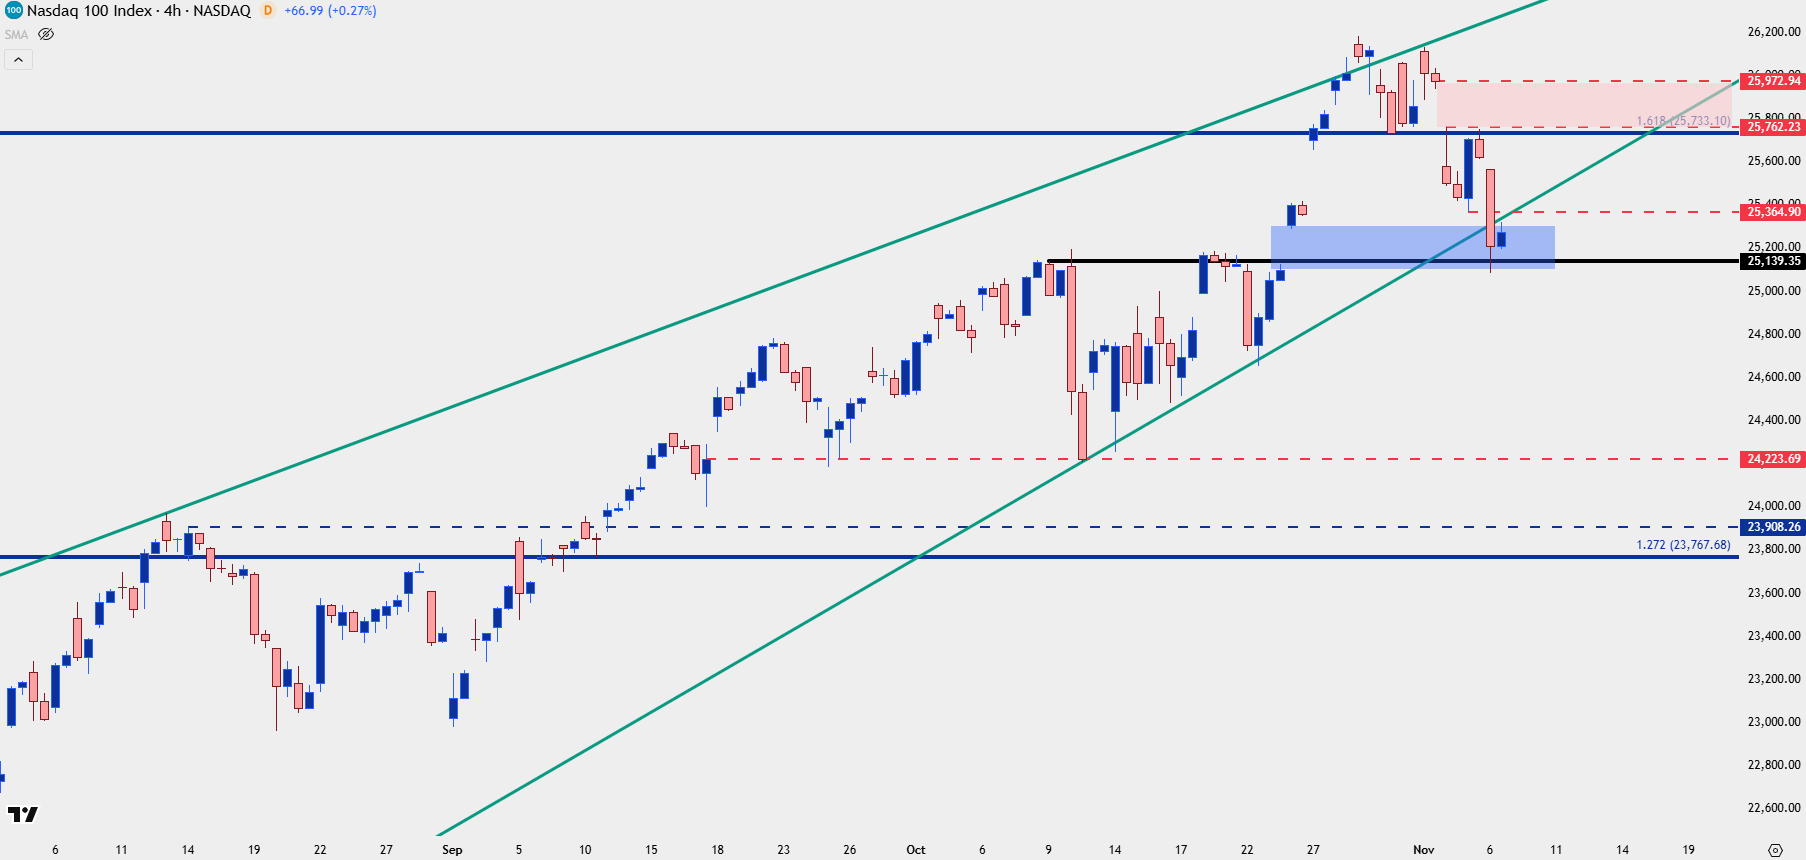
Chart prepared by James Stanley; data derived from Tradingview
--- written by James Stanley, Senior Market Analyst, Global Macro