
Daily charts for DXY are messy as what I think was a bad tick to start this week obscures the technical backdrop. I explained that in the early part of this webinar but on a shorter-term basis, it’s the reaction to support at 98.28 that stands out, with a stark run of strength as markets have priced down the probably of a rate cut from the Fed later this year.
As usual, I have setups on either side of the USD for this webinar and I’ll explore some of those high points below.
US Dollar Four-Hour Price Chart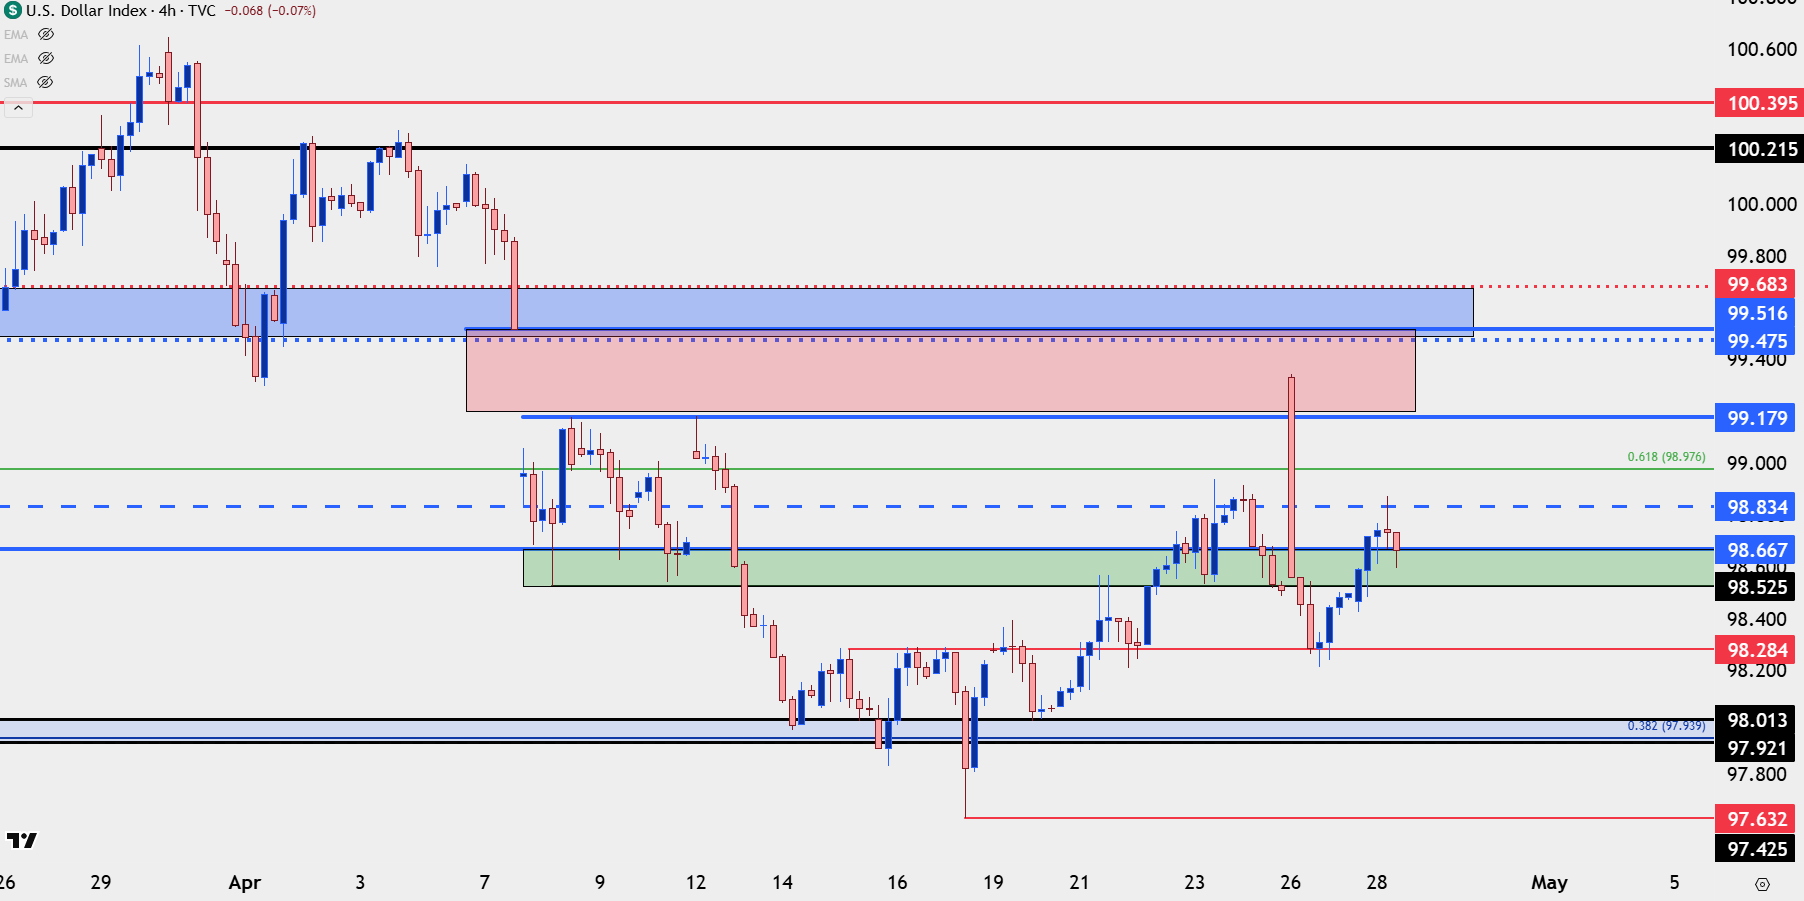
Chart prepared by James Stanley; data derived from Tradingview
EUR/USD
I’m keeping EUR/USD as a setup for bearish USD strategies going into FOMC but at this point, bulls haven’t exactly taken control, although we may be at the early stages of that. There’s an attempted hold at the 1.1686 Fibonacci level and if today’s low remains in place through the close, this would qualify as a higher-low. So far, there’s been resistance at prior support, from around 1.1748-1.1766 so that’s the spot that bulls need to beat to continue this stalling into a short-term bullish trend, that could amount to bigger picture bullish resumption at which point 1.1835 comes back on the radar.
EUR/USD Daily Price Chart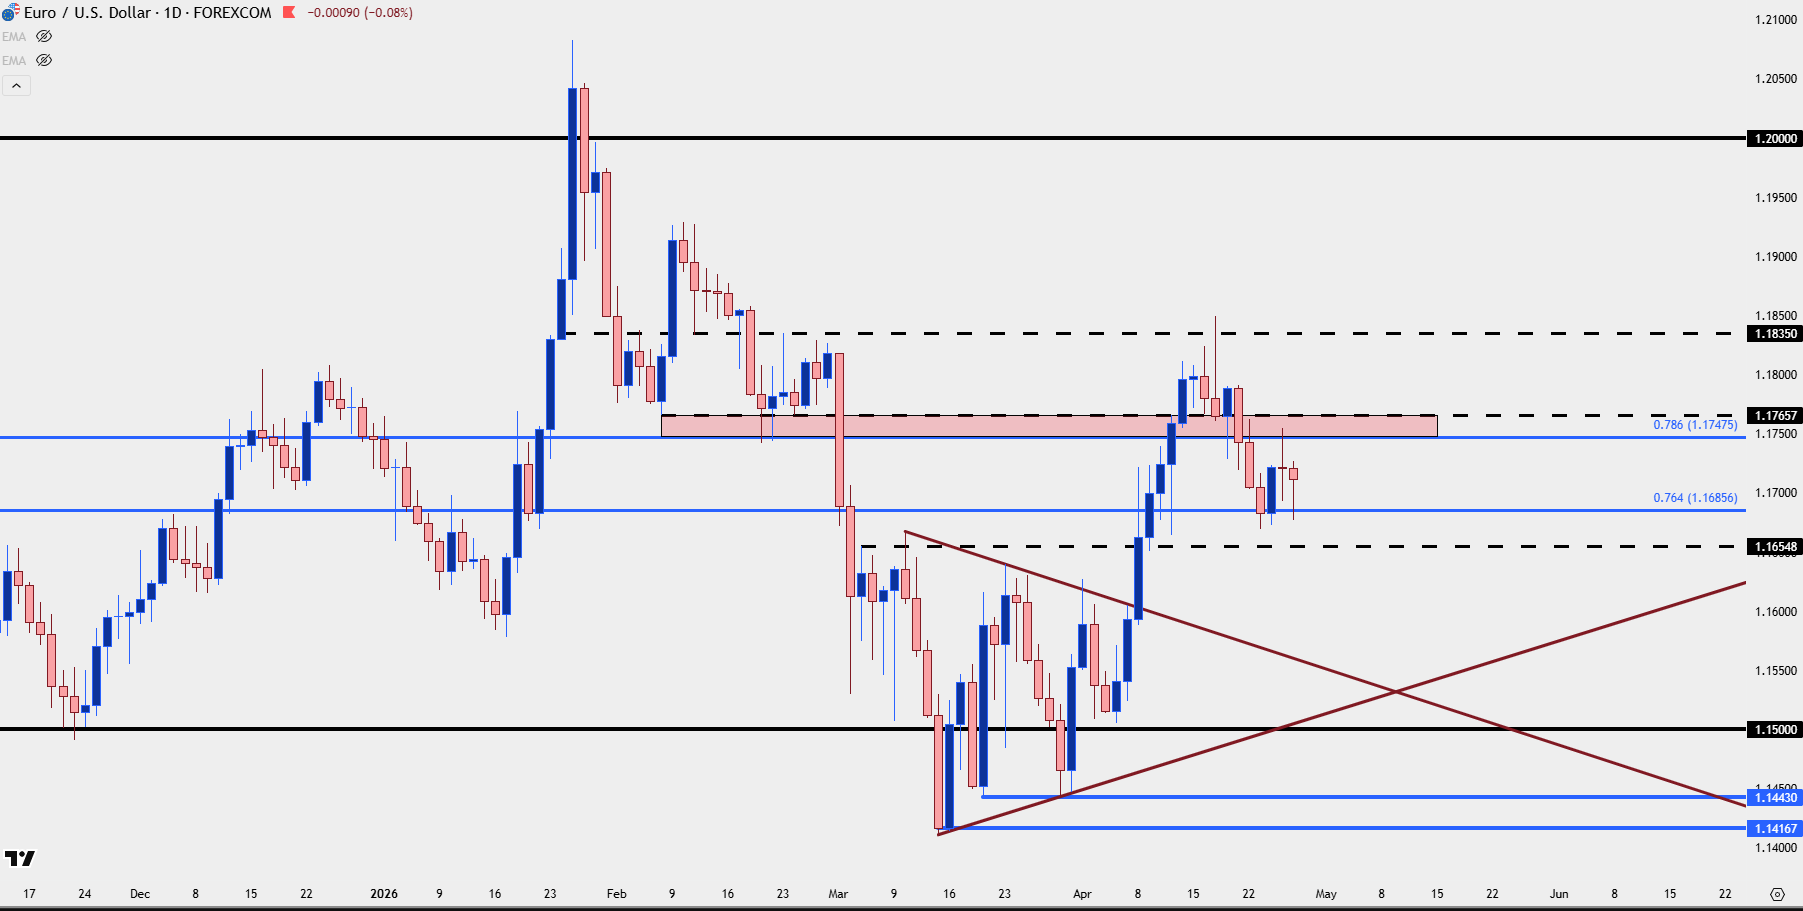
Chart prepared by James Stanley; data derived from Tradingview
GBP/USD
I looked into the British Pound yesterday across a few different pairings and as I shared there, I think there’s a case for GBP being a more attractive candidate for USD-weakness than the Euro. Much of that sources from the chart of the cross pair in EUR/GBP, but in the major of GBP/USD, there’s been a higher-low support hold and as I showed in the webinar, that looks a bit cleaner in GBP/USD than EUR/USD. Also, in GBP/USD there’s a hold of support in a key zone, running from 1.3484-1.3500, which has so far led to a bounce.
Next resistance overhead is at the 1.3568 level, after which 1.3600 comes into the picture. That’s a big spot that so far bulls have not been able to do much above.
GBP/USD Four-Hour Price Chart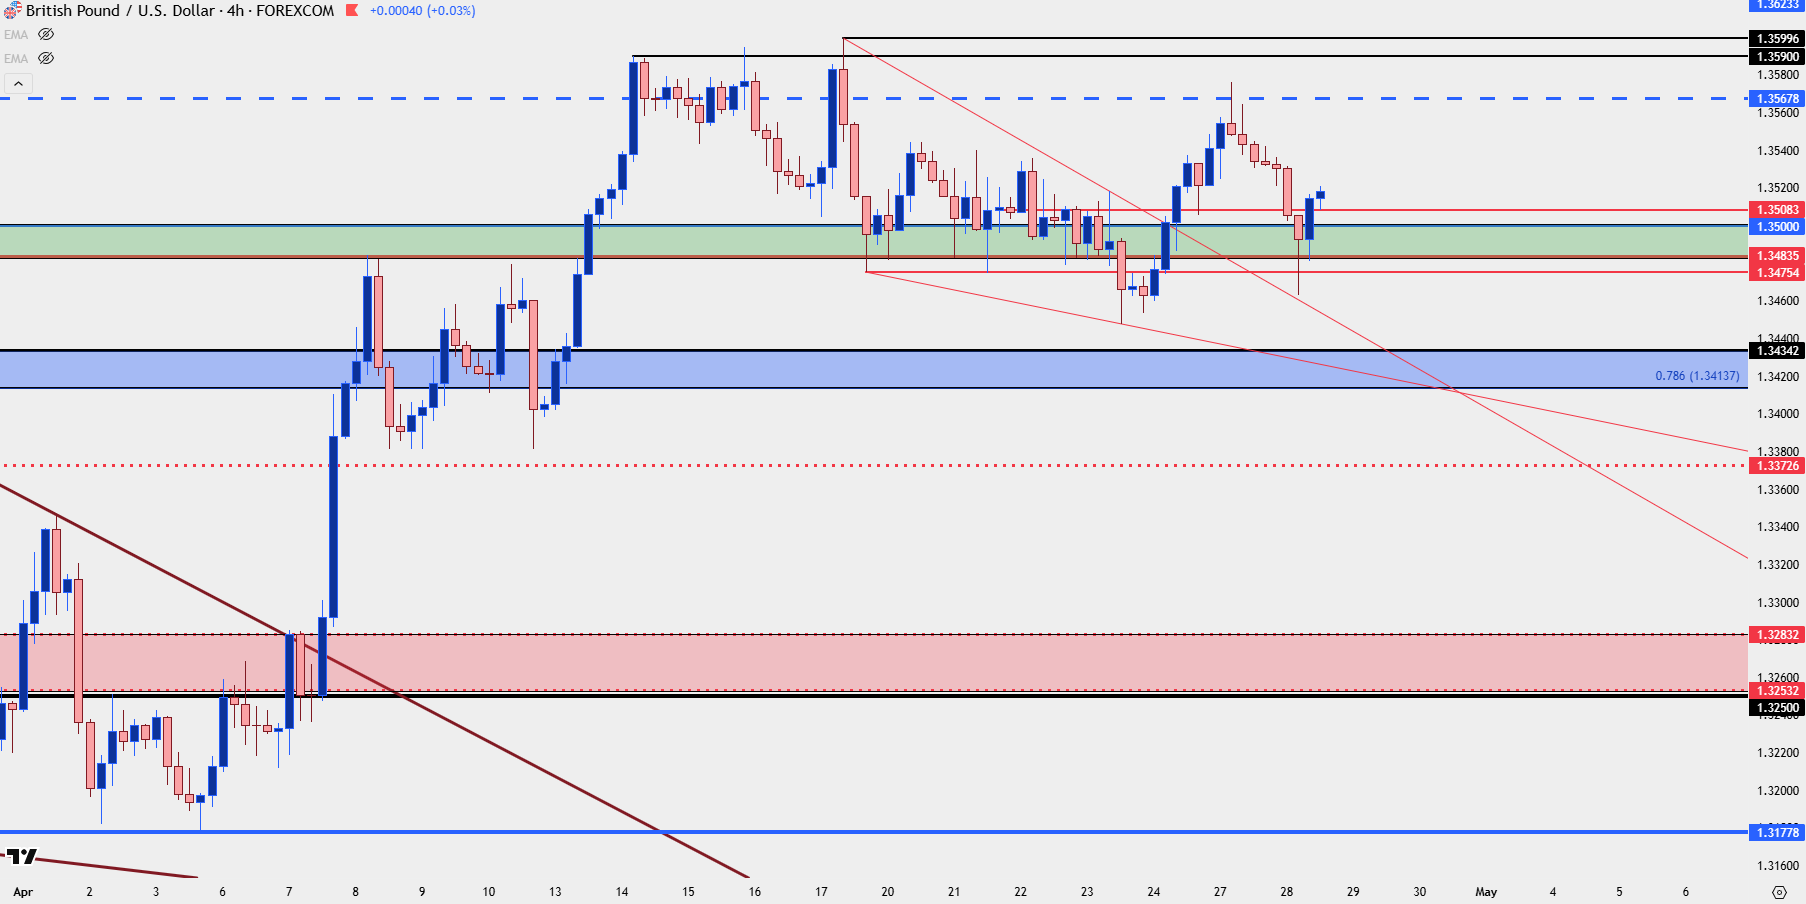
Chart prepared by James Stanley; data derived from Tradingview
USD/JPY
A hawkish Ueda in January helped to fuel a massive sell-off in USD/JPY as markets geared up for the possibility of narrowing rate differentials. That dip was ultimately bought up by longs and eventually price scaled back up to the 160.00 level. But notably there’s been a different response to this iteration of a hawkish Ueda, where prices have held very close to the 160.00 level in the USD/JPY pair.
As I’ve been saying, I think there’s a backdrop that can support a breakout particularly if we see tensions in the Middle East leading to higher oil prices and a stronger US Dollar. In that scenario, the Bank of Japan may not find a quick intervention to be so simple, instead choosing to not burn finite FX reserves to defend a spot rate that’s already been traded through. Instead, it’s the 161.95 and 165.00 levels sitting overhead that could make for a more strategic line-in-the-sand should a breakout take hold.
With that said – for a breakout to hit we’re likely going to need to hear or see Powell take a hard line on inflation on the basis of higher oil prices, so the situation would need a few pieces to fall into place for that scenario to happen, but it does seem as though the pieces are there.
USD/JPY Daily Price Chart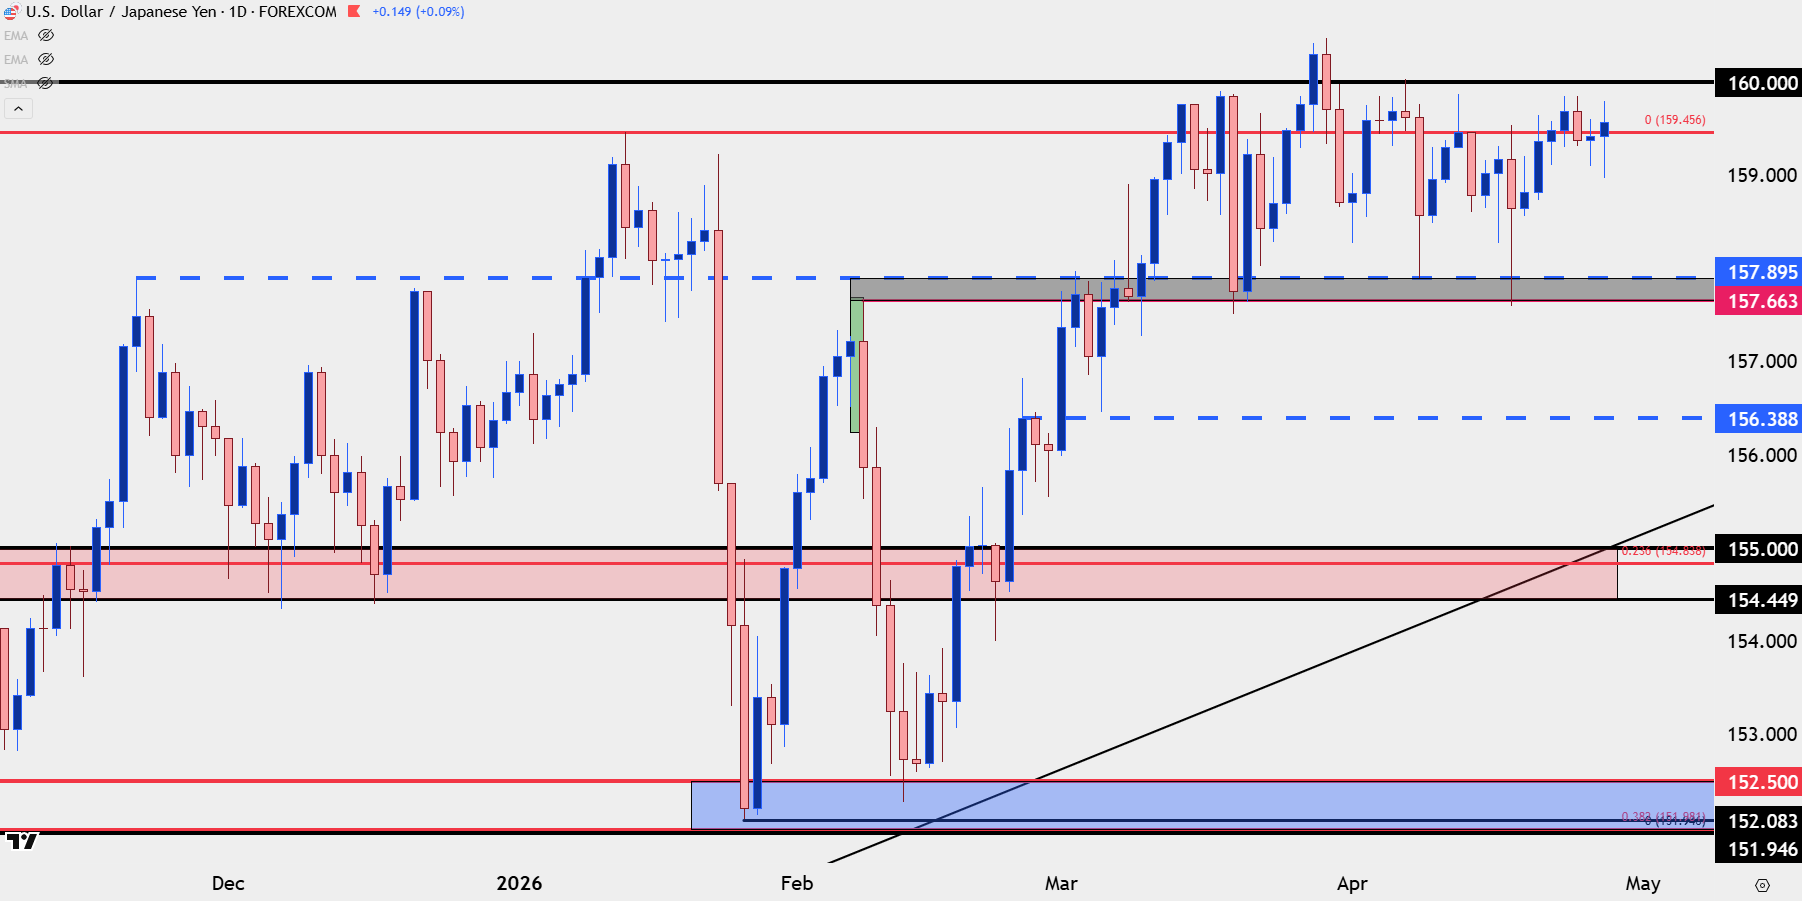
Chart prepared by James Stanley; data derived from Tradingview
Gold
Last but most certainly not least, we have the set up in gold. I’ve been tracking a descending triangle here ever since last week’s rising wedge breakdown. From the rising wedge we had Fibonacci support at 4671, and that level held a few different bounces with lower-highs showing after each until this week’s breakdown took over.
That price is now resistance potential if bulls can force a pullback but before that comes into play we’ve seen some selling at 4600. Near-term, as looked at in the webinar, I think there’s an open door for bulls to push a break of 4600 but overhead resistance then becomes an issue at 4671 or perhaps the bearish trendline that’s guided the lows since last week’s high.
Gold Four-Hour Chart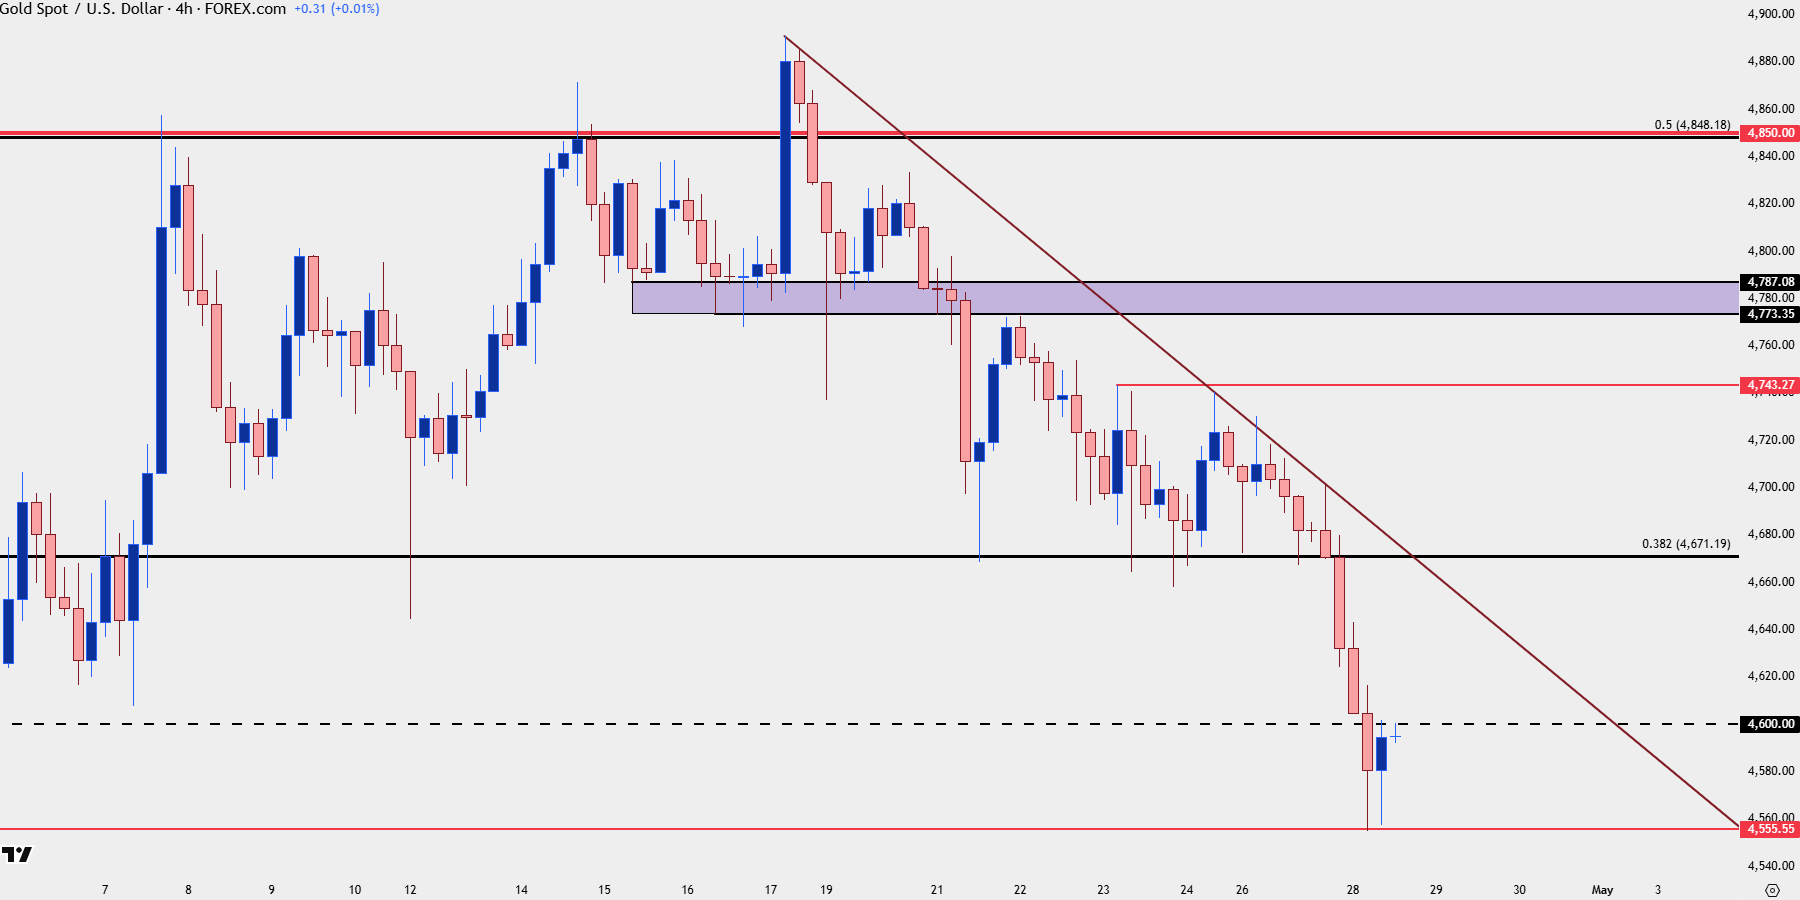
Chart prepared by James Stanley; data derived from Tradingview
--- written by James Stanley, Senior Market Analyst, Global Macro