
US Dollar Technical Outlook:
- The US Dollar is working on its second week of gains and this week was climactic, with an initial push from bears around the FOMC rate decision that was quickly snapped back on Thursday morning.
- As noted previously, there were a few factors of importance on Thursday, as there was strong US data to go along with a dovish twist from the European Central Bank.
- This week helped to further erase the prior CPI-fueled breakout in EUR/USD and breakdown in the USD. With one trading day left for the month of July the monthly charts are showing interest for reversal scenarios given that dynamic.
- This is an archived webinar that we host every Tuesday at 1PM ET. If you’d like to register, it’s free to do so from the following link: Click here to register.
It was a big week for global markets and there were multiple episodes of volatility as we heard from the Federal Reserve, ECB and the Bank of Japan, amongst a number of data releases. I touched on some of that in yesterday’s article and in this piece, I wanted to take a step back to look at price action in a number of related markets.
Of note, there is one day left for the current monthly bar to complete, and at this point, there are some possible reversals to evaluate as the mid-month breakout in EUR/USD now looks like a failure.
In the US Dollar, I had highlighted this premise coming into the week as the earlier breakdown move pulled back during the prior weekly bar, and this opened the door for bears to show at lower-high resistance. This did take place briefly ahead of the FOMC rate decision as resistance had held around the 101.50 level which was also the 50% mark of the breakdown move.
The FOMC-fueled breakout held support above 100.50, and that led into a sharp bullish move that developed on Thursday morning. Price jumped up to the key level of prior support at 102 and as we move towards the end of the week, that resistance has held.
This could keep the door open for bears as that spot of prior support is now showing as resistance, and this could turn out to be a lower-high although bears will need to respond relatively soon.
US Dollar - DXY Daily Price Chart (indicative only, not available on Forex.com platforms)
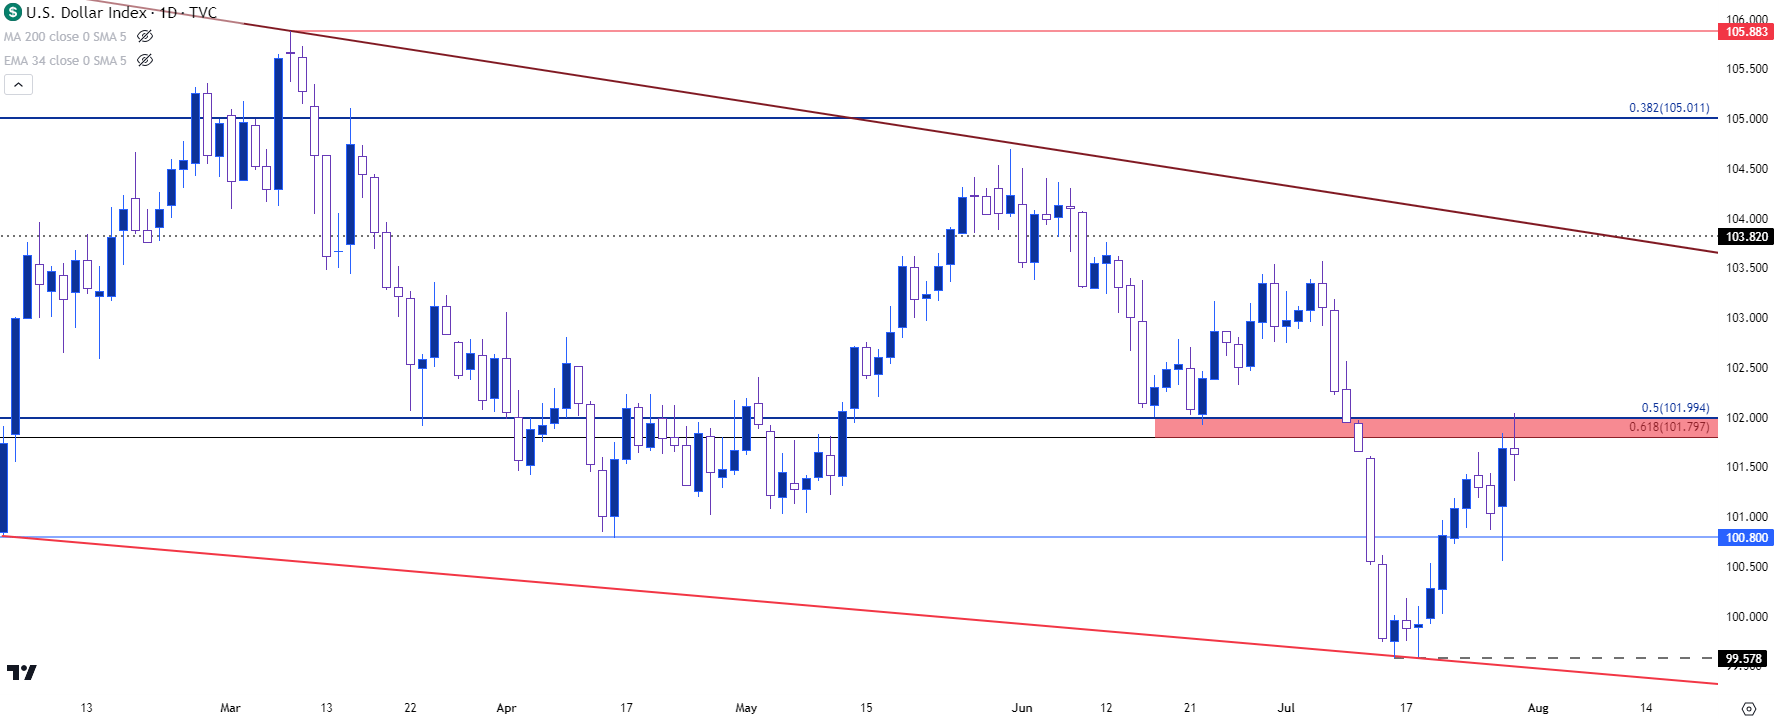 Chart prepared by James Stanley; data derived from Tradingview
EUR/USD
EUR/USD pushed a strong breakout after US CPI earlier in July but, so far that breakout appears to have faltered. Price continued to push higher after that CPI print but eventually found resistance at the 1.1256-1.1275 zone. That latter price is particularly key as this is the 61.8% retracement of the 2021-2022 major move.
Thursday morning was especially key as we had the European Central Bank rate decision alongside the release of US GDP and durable goods and given that this was less than 24 hours after the Fed talked up a role of data dependency, positive data on both of those prints coincided with a bearish run in the Euro to create a really strong bearish move in EUR/USD.
Price ran all the way until stalling just before the 1.0943 level, which is the 50% mark of that same Fibonacci retracement. From the weekly chart, a support hold there could keep the door open for bulls, similar to the mirror image scenario looked at above in the USD.
But, given the pace of the sell-off combined with the levels that were taken out, bears could make a show here if they can come in to hold lower-high resistance. The monthly close will be another piece to this puzzle and as noted earlier there’s one trading day left next week before that monthly bar completes.
EUR/USD Weekly Price Chart
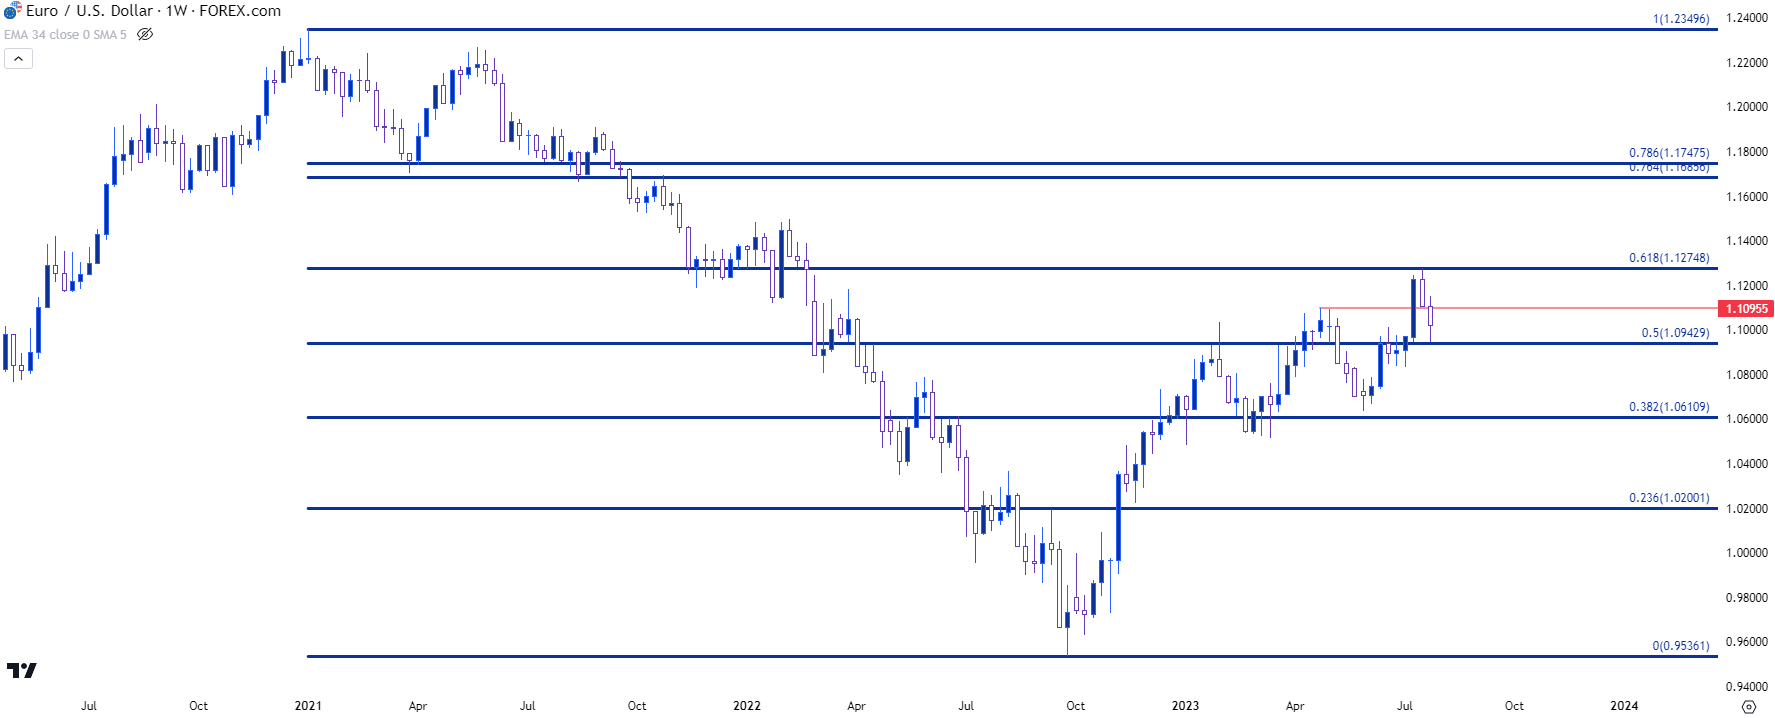 Chart prepared by James Stanley, EUR/USD on Tradingview
USD/JPY
The Bank of Japan caused some commotion this week. First there was the rumor that the bank may be looking at a tweak to their yield curve control policy. And given how dovish the bank has been this was thought to be a hawkish move. The BoJ then announced that they would buy bonds up to the 1% threshold which, in essence, widens the band from the previous upper limit of 0.5%. So that even takes on the appearance of a hawkish move, even if minor as it’s not quite a rate adjustment.
But during the accompanying press conference, BoJ Governor Kazuo Ueda continued to downplay the move, instead presenting it as further leaning into easing rather than tightening. He had a number of other comments that could be perceived as dovish, as well, such as saying that there was no change to the judgement that achieving the 2% inflation target is still distant.
This took on a similar tone as the dovish hike from the ECB earlier on Thursday but, again, this wasn’t a hike as it was merely widening out the band for the bank’s QE purchases. But, deductively, it does beg the question as to whether more change is on the horizon, especially considering how consistent inflation has been showing in Japan of late.
Nonetheless, price action around that event was chaotic and a less than a day later USD/JPY is back above the 140.00 handle, testing trendline resistance. Given the context of the fundamental situation, it may take some time to get a proper read on how markets are incorporating this latest twist from the BoJ. Because the fact of the matter is that inflation has been persistent, and if we simply read the actions from the bank without the commentary from the press conference, it would appear as the BoJ is responding to such.
USD/JPY Four-Hour Chart
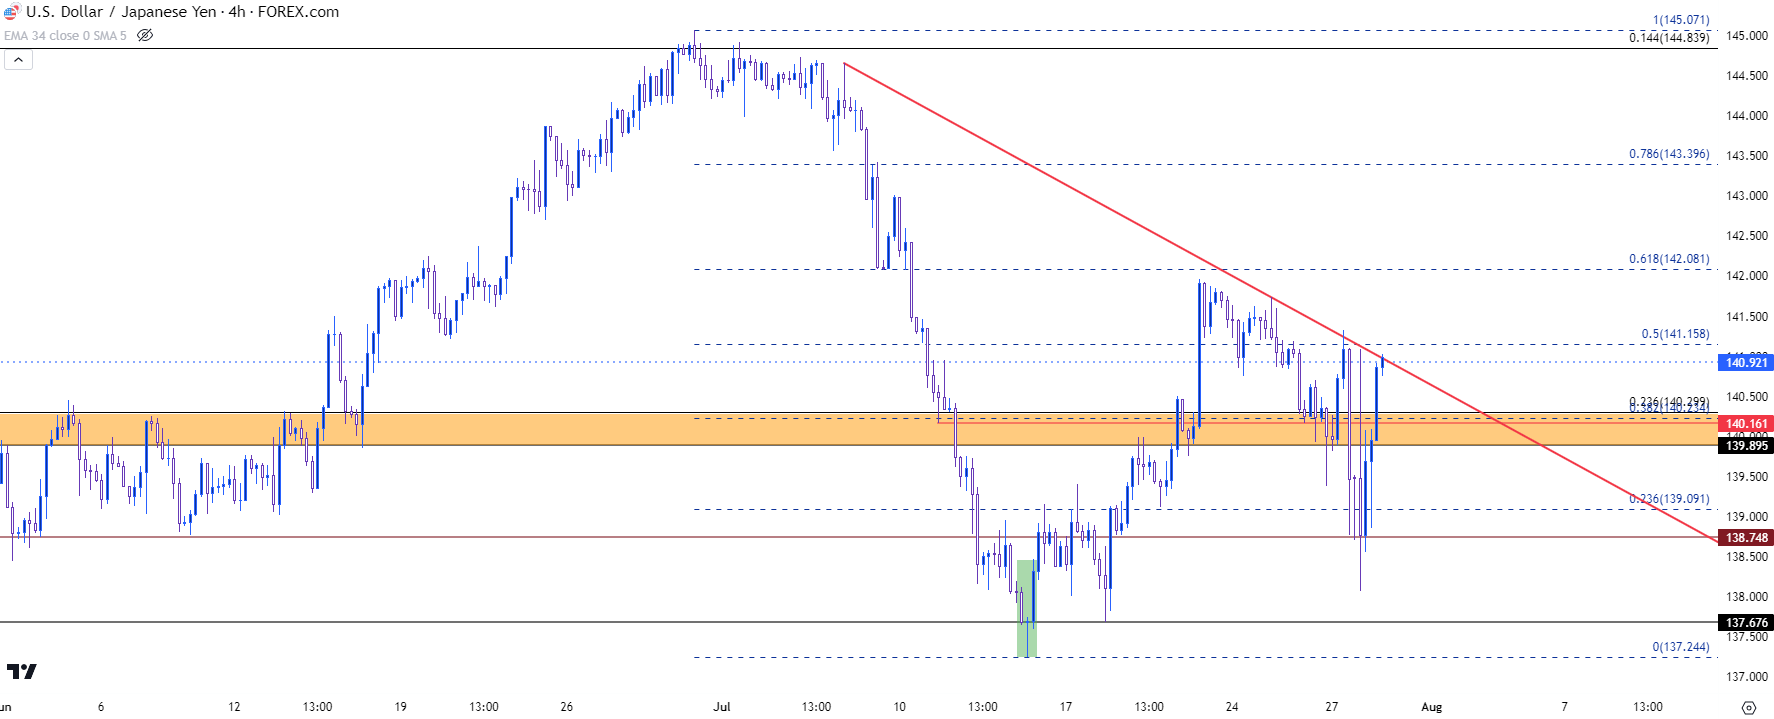 Chart prepared by James Stanley, USD/JPY on Tradingview
--- written by James Stanley, Senior Strategist