
US Dollar Outlook: USD/CHF
USD/CHF extends the advance from the start of the week to trade above the 50-Day SMA (0.8082) for the first time since February, and the exchange rate may no longer track the negative slope in the moving average as it pushes back above the former support zone around the April low (0.8040).
USD/CHF Trades Above 50-Day SMA for First Time Since February
USD/CHF climbs to a fresh monthly high (0.8125) as the US Gross Domestic Product (GDP) report shows a 3.0% expansion in the second quarter of 2025 versus forecasts for a 2.4% print, and the exchange rate may further retrace the decline from the June high (0.8250) as it establishes a series of higher highs and lows.
US Economic Calendar
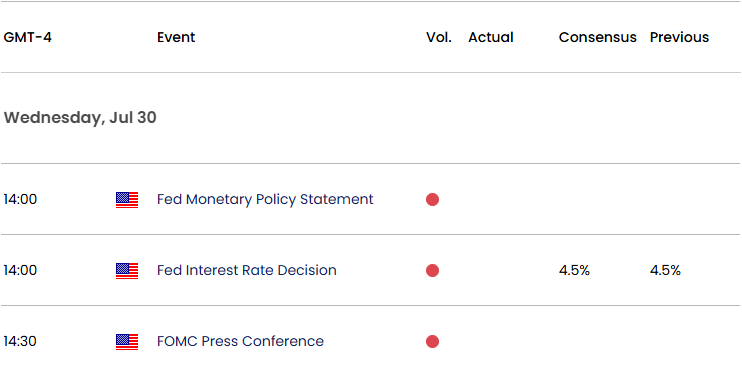
At the same time, the Federal Reserve rate decision may sway USD/CHF even though the central bank is expected to keep US interest rates on hold should Chairman Jerome Powell and Co. stay on track to further unwind its restrictive policy.
Join David Song for the Weekly Fundamental Market Outlook webinar. David provides a market overview and takes questions in real-time. Register Here
In turn, speculation for an imminent Fed rate-cut may drag on the Greenback as the central bank still forecasts that the ‘appropriate level of the federal funds rate will be 3.9 percent at the end of this year,’ but a change in the forward guidance for monetary policy may keep USD/CHF afloat should the FOMC show a greater willingness to keep US interest rates higher for longer.
With that said, USD/CHF may attempt to test the June high (0.8250) as it trades back above the former support zone around the April low (0.8040), but the exchange rate may consolidate over the remainder of the week should it struggles to extend the bullish price series.
USD/CHF Price Chart – Daily
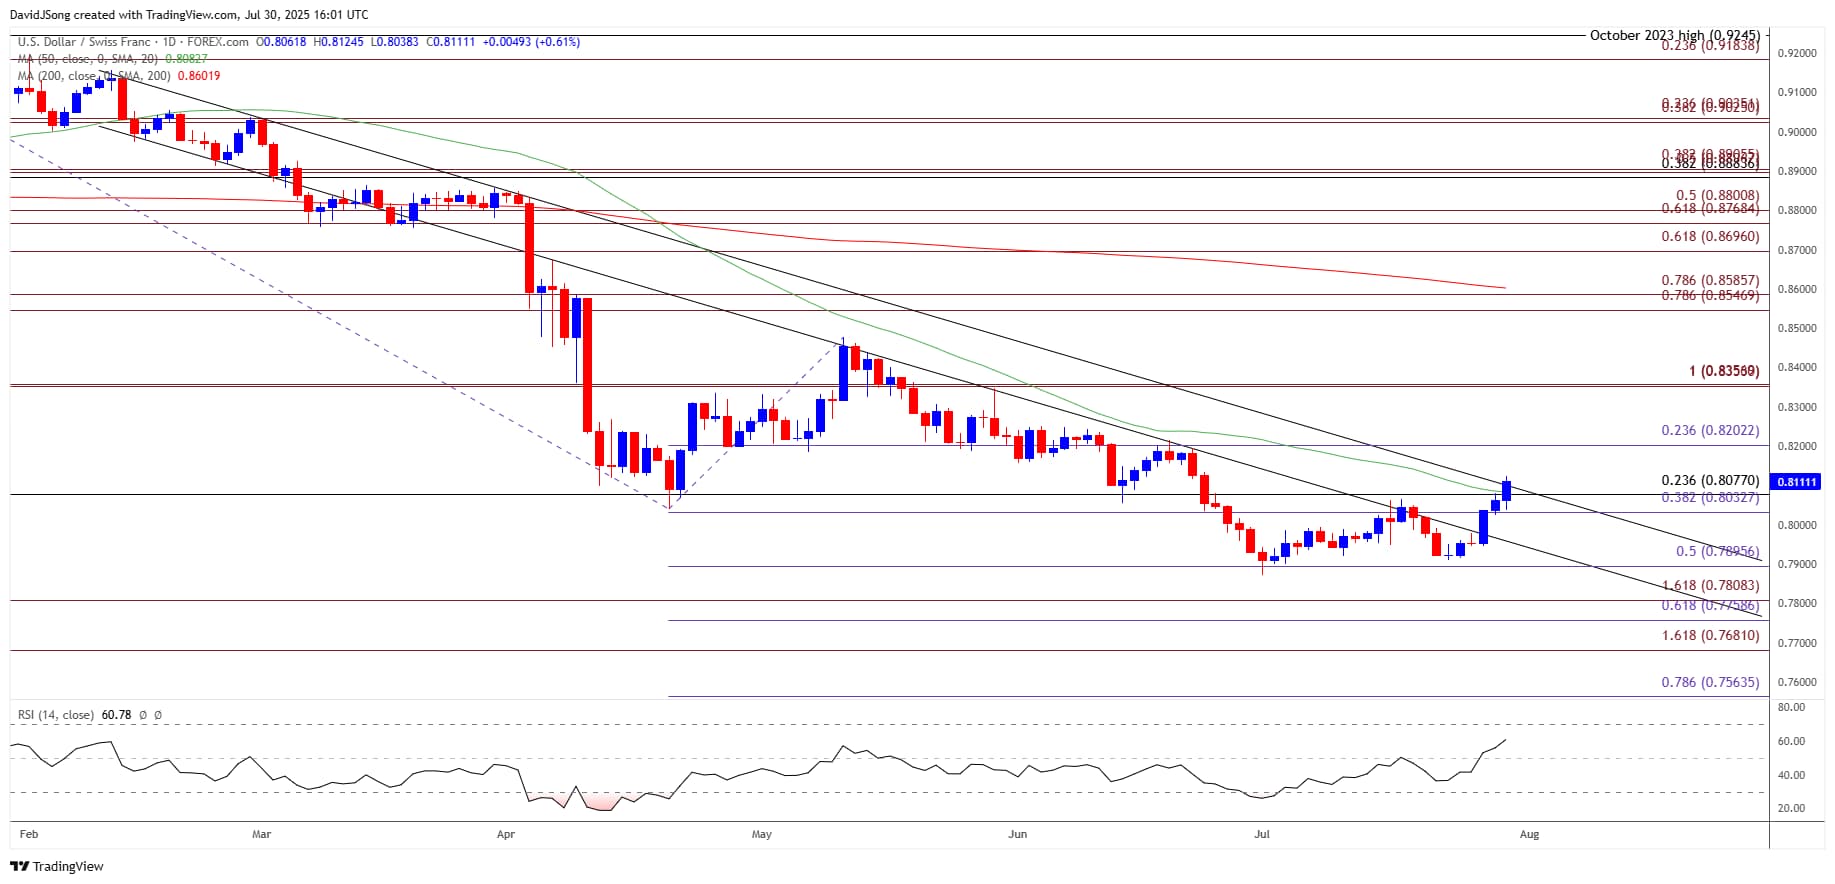
Chart Prepared by David Song, Senior Strategist; USD/CHF Price on TradingView
- USD/CHF climbs to a fresh monthly high (0.8125) as it stages a three-day rally, with a close above the 0.8030 (38.2% Fibonacci extension) to 0.8080 (23.6% Fibonacci retracement) zone raising the scope for a move toward 0.8200 (23.6% Fibonacci extension).
- A breach of the June high (0.8250) opens up 0.8360 (100% Fibonacci extension), but USD/CHF may negate the recent series of higher highs and lows if it struggles to hold above the 0.8030 (38.2% Fibonacci extension) to 0.8080 (23.6% Fibonacci retracement) zone.
- Need a move/close below 0.7900 (50% Fibonacci extension) to bring the monthly low (0.7872) on the radar, with the next area of interest coming in around 0.7760 (61.8% Fibonacci extension) to 0.7810 (161.8% Fibonacci extension).
Additional Market Outlooks
USD/JPY Fails to Test July High Ahead of Fed Rate Decision
British Pound Forecast: GBP/USD Falls to Fresh Monthly Low
AUD/USD Fails to Test November High Ahead of Australia CPI
Canadian Dollar Forecast: USD/CAD Approaches Monthly High
--- Written by David Song, Senior Strategist
Follow on Twitter at @DavidJSong