So far this year there’s seemed to be a bullish response to the Dollar around Fed meetings, even if the broader trend has been decisively bearish. In June, a post-FOMC rally was extinguished on the following Monday as Michelle Bowman said that she was ready to cut rates in July, and that illustrates well the tug-of-war at the Fed where Jerome Powell has seemed less dovish than what other voting members and the bank’s own forecasts have suggested. July saw a strong breakout in USD after Powell said that policy didn’t seem overly restrictive given inflation and labor market data, and then the September rate cut announcement sparked a series of higher-highs and lows that remains in-place today as Powell framed the cut as a ‘risk management rate cut.’

I spoke of this at-length in yesterday’s webinar while also looking at setups around the Dollar. At the time, we had a support test showing at the top of a key zone, running from 98.44 up to 98.60. That can help to substantiate an argument of higher-lows that remains from the Fed’s rate cut announcement last month, but there’s also the matter of resistance as the 98.98 Fibonacci level has held the highs in DXY for the past week and change.
Above that, there’s the 99.40 level and then the 100-100.22 zone that’s of interest; while there’s deeper support potential in the gap produced from the early-October move spanning down to 97.71 up to 97.96.
US Dollar Daily Price Chart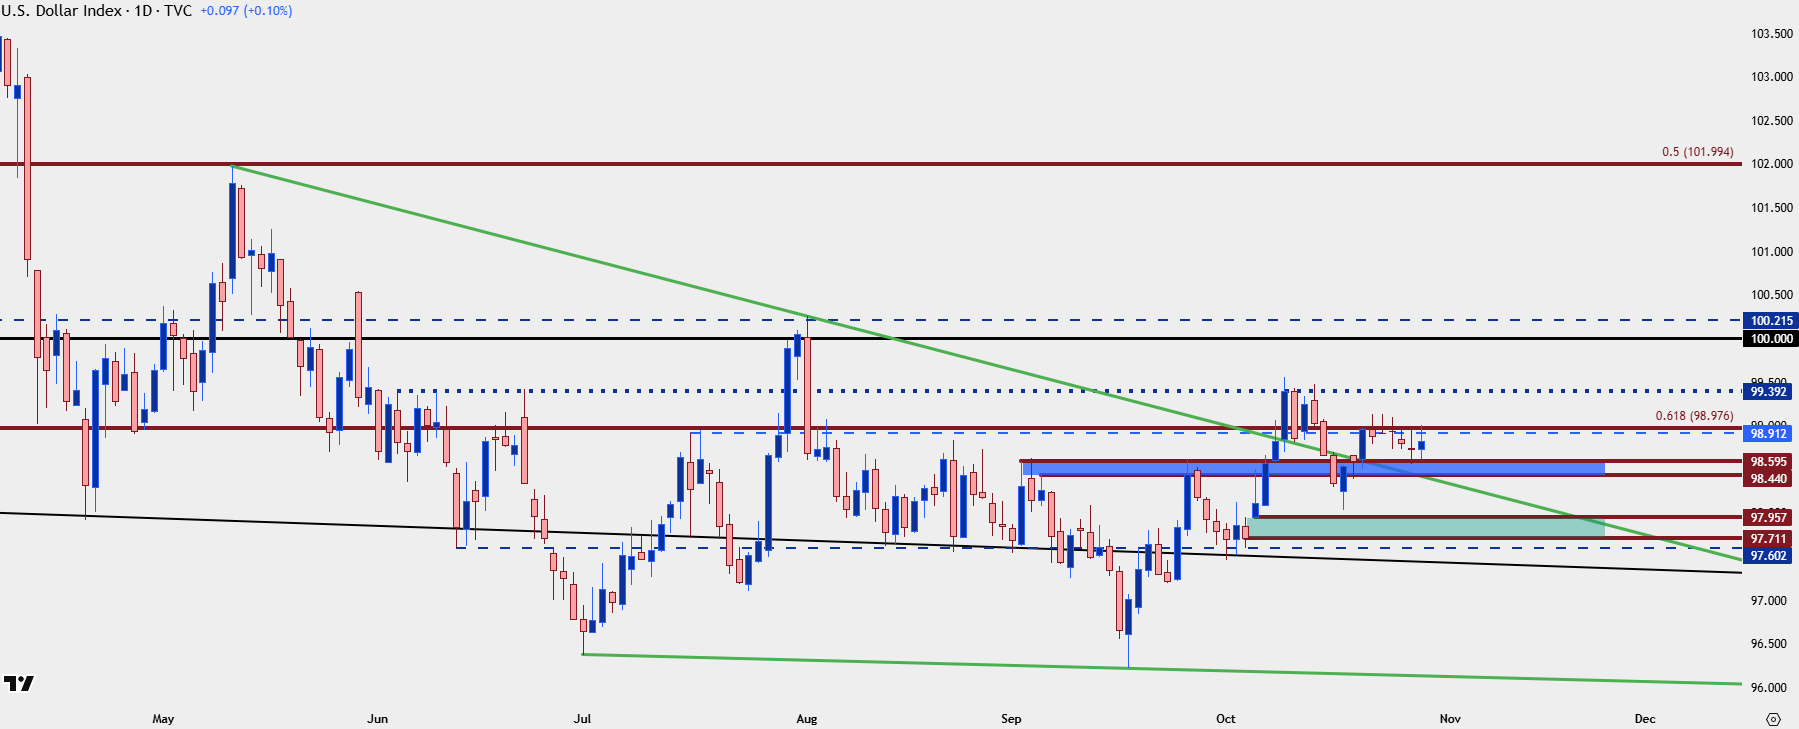
Chart prepared by James Stanley; data derived from Tradingview
USD Broader Trends
Given the backdrop I think the longer-term look is notable here. The more intense part of this year’s USD trend took place in the first half of the year, as USD dropped quickly on the back of worsening economic data and building expectations for rate cuts. But, since the first day of Q3, USD bears haven’t been able to do much especially on tests of lows.
We did get the print of a fresh three-year low on the Fed’s rate cut announcement in September, but that led to a strong bullish pattern. From the weekly chart below, there’s a falling wedge formation which is often approached with aim of bullish reversal, and that door remains open.
Also notable here is the 98.98 level, which is the 61.8% Fibonacci retracement of the 2021-2022 rally. The 50% mark of that same major move is at 102, and that’s the level that held a lower-high back in May, in a rally that was helped along by an FOMC meeting early that month. This also provides some context for follow-through resistance should buyers budget up to fresh highs and finally push beyond that 98.98 resistance level.
US Dollar Weekly Price Chart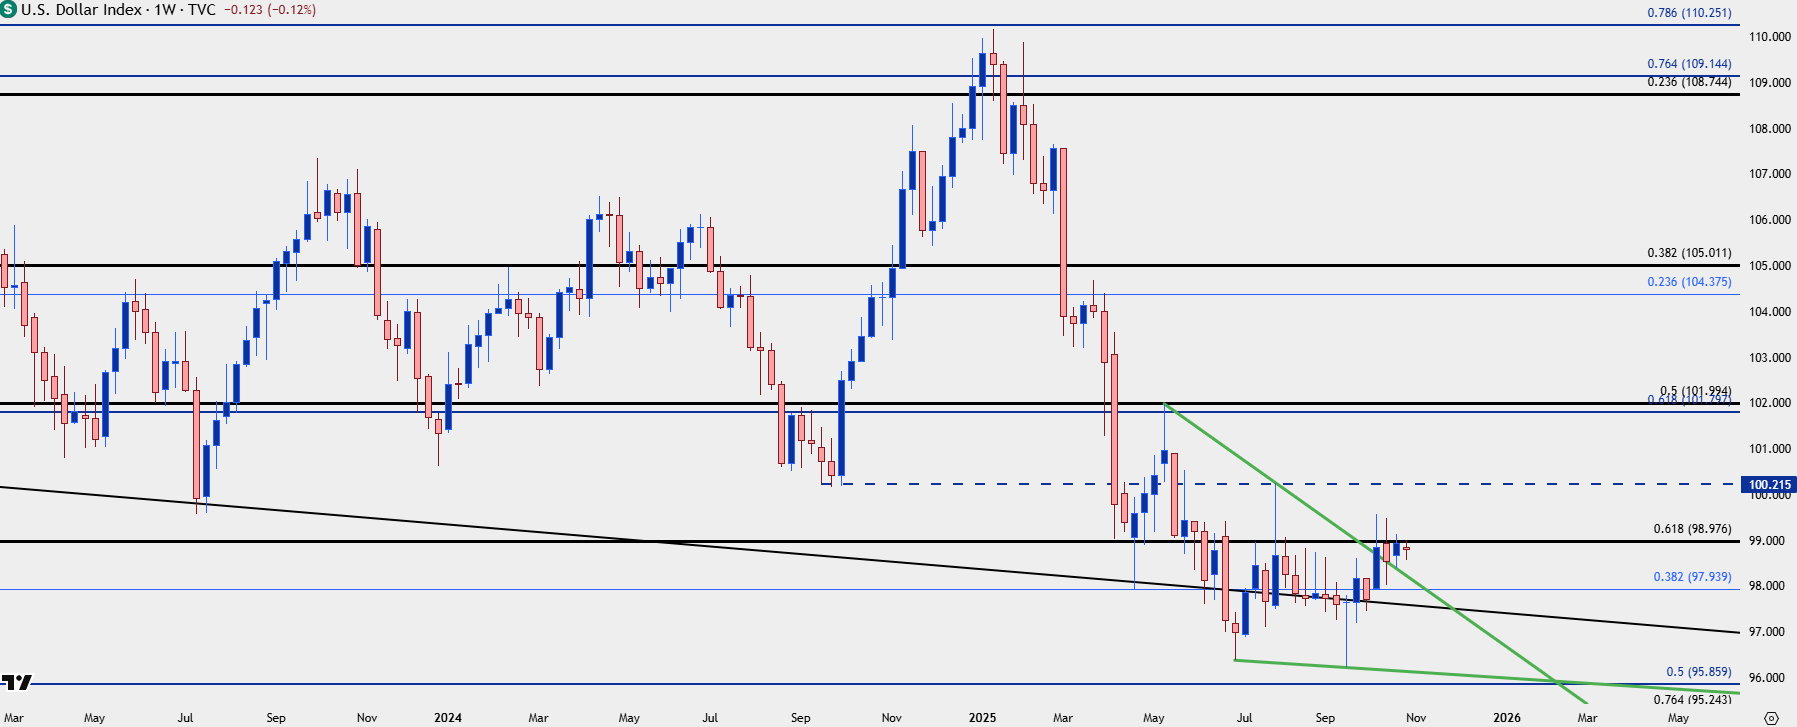
Chart prepared by James Stanley; data derived from Tradingview
USD Long-Term
Taking an even further step back we can further add importance to today’s meeting, as the monthly bar highlights a possible morning star formation. With last month completing as a doji even with the Fed’s start to rate cuts, the October bar can confirm a morning star with a monthly close above that 98.98 level.
There’s more than the Fed to consider here, however, as the Bank of Japan rate decision later tonight is followed by a European Central Bank rate decision tomorrow, both of which can provide push to large components of the DXY basket and, in-turn, help to drive Dollar trends.
US Dollar Monthly Price Chart
Chart prepared by James Stanley; data derived from Tradingview
--- written by James Stanley, Senior Strategist