- US Core CPI momentum accelerates to 3.75% annualized
- One-year USD OIS jumps 27.5bp, mostly after CPI
- Fed officials flag faster, potentially larger hikes
- USD/JPY leads rate sensitivity; USD/CAD tests 1.4200
USD/JPY and USD/CAD are in focus following a sharp hawkish repricing of the US Federal Reserve's interest rate outlook, with the largest move coming on Tuesday after hotter-than-expected US core inflation data for October.
With both pairs showing relatively strong correlations with changes in US interest rate expectations, what appears to be a concerted effort by Fed officials to prepare markets for a potential 50-basis-point hike in December, or a faster pace of tightening, may have important implications for near-term directional risks.
US inflation pressures build again
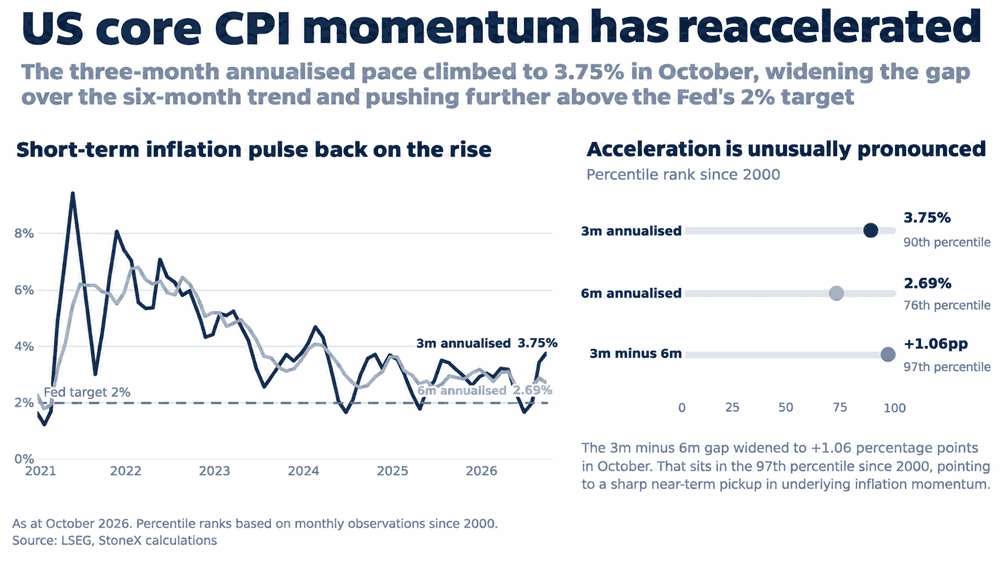
Tuesday's US Consumer Price Index report delivered another overshoot relative to market expectations, with headline CPI rising 0.4% in October and core inflation increasing 0.3%, both a tenth above the median economist forecast. For core, it marked the third consecutive 0.3% monthly increase, strengthening the view that the disinflationary pulse seen around the middle of the year has all but reversed, with upside risks beginning to materialise again.
Source: LSEG
Three-month annualised core CPI has now accelerated to 3.75%, compared with 2.69% over six months. The gap between the two measures, a useful gauge of near-term inflation momentum, now sits in the 97th percentile of observations dating back to 2000, highlighting just how sharply price pressures have picked up.
Attention now turns to Friday's producer price report, which will help refine estimates for October's core PCE inflation reading due later this month. Even before that arrives, early estimates point to another monthly increase exceeding 0.3%, reinforcing concerns among Fed officials that progress in returning inflation to the 2% target is not just stalling, but potentially reversing.
Fed hawks turn up the heat
Making October's 0.3% core CPI print potentially more consequential was a warning from influential Fed Governor Christopher Waller ahead of its release. Waller said an increase of that magnitude would warrant considering a 50-basis-point hike at the Fed's December meeting, arguing that moving by only 25 basis points could put the central bank's inflation-fighting credibility at risk.
Waller's remarks often carry significant weight in financial markets, given his perceived influence in communicating the broader committee's thinking. Along with New York Fed President John Williams, he played a pivotal role in steering markets away from pricing a rate hike at the Fed's October meeting, suggesting there was no need for the central bank to tighten at consecutive meetings. Having helped talk down expectations just weeks ago, his abrupt shift to openly discussing supersized moves should make traders sit up and take notice. It also puts greater emphasis on what Williams has to say when he's next due to speak.
It wasn't just Waller delivering a hawkish message during the session. Dallas Fed President Lorie Logan argued that the policy rate remains at least 50 basis points below what she considers a modestly restrictive level, with the real fed funds rate estimated at just 0.78%. She maintained that at least two further quarter-point hikes were needed, while also flagging the potential to accelerate the pace of tightening.
Fed Vice Chair Michelle Bowman also signalled a greater focus on inflation following signs of stabilisation in the labour market. While stopping short of advocating a specific rate increase, she warned that persistent pressures from energy prices, tariffs and AI-related investment could delay progress towards the Fed's 2% inflation target.
Markets price a more aggressive Fed tightening cycle
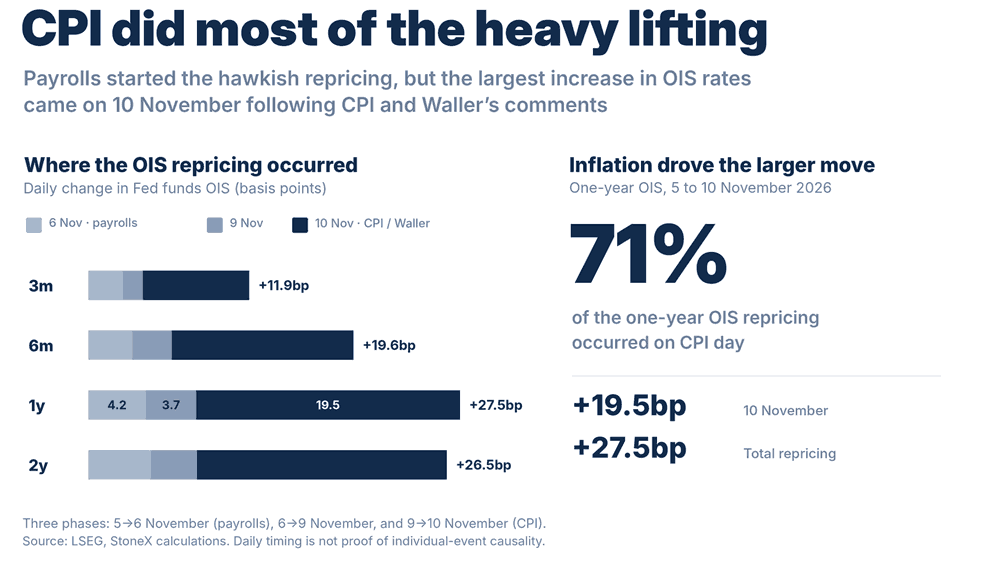
Waller's comments, Tuesday's CPI report and Friday's strong non-farm payrolls report for October have triggered a substantial hawkish repricing of the US interest rate outlook, as seen in the graphic below. Since Thursday's close last week, the one-year Fed funds OIS rate, a rough gauge of the average overnight interest rate markets expect over the coming year, has climbed 27.5 basis points, with 19.5 basis points, or roughly 71% of that move, occurring on Tuesday following the inflation report.
Source: LSEG
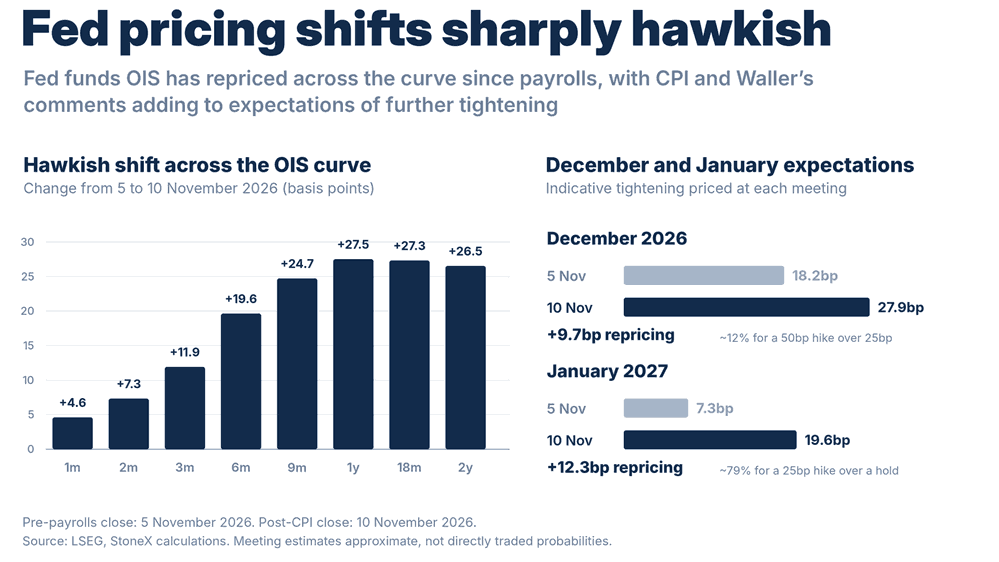
There has also been a significant hawkish repricing across the curve, with six-month OIS rates rising 19.6 basis points, while the 18-month and two-year tenors have increased by 27.3 and 26.5 basis points, respectively. Put simply, recent events and commentary have seen markets price in a greater likelihood of interest rates remaining higher for longer.
Source: LSEG
For the December meeting specifically, STIR traders have moved from pricing around 18 basis points of tightening before Friday's payrolls report to nearly 28 basis points now. That implies a 25-basis-point hike is fully baked into the cake, with approximately a 12% probability of a 50-basis-point move, assuming those are the only two outcomes. Additional tightening priced for January has also increased from around 7 to nearly 20 basis points, reinforcing the message that markets are preparing for either a supersized December hike or a strong possibility of back-to-back rate increases.
Markets tighten before the Fed moves
It's not just through the interest rate channel that the Fed appears to be looking to regain control of the inflation battle. Waller argued that the Fed's earlier communications had already prompted markets to anticipate further tightening, helping justify the decision to leave rates unchanged in October. However, he stressed that "what really matters is that those hikes are eventually carried out." Otherwise, expectations could reverse, dragging market interest rates lower and loosening financial conditions again.
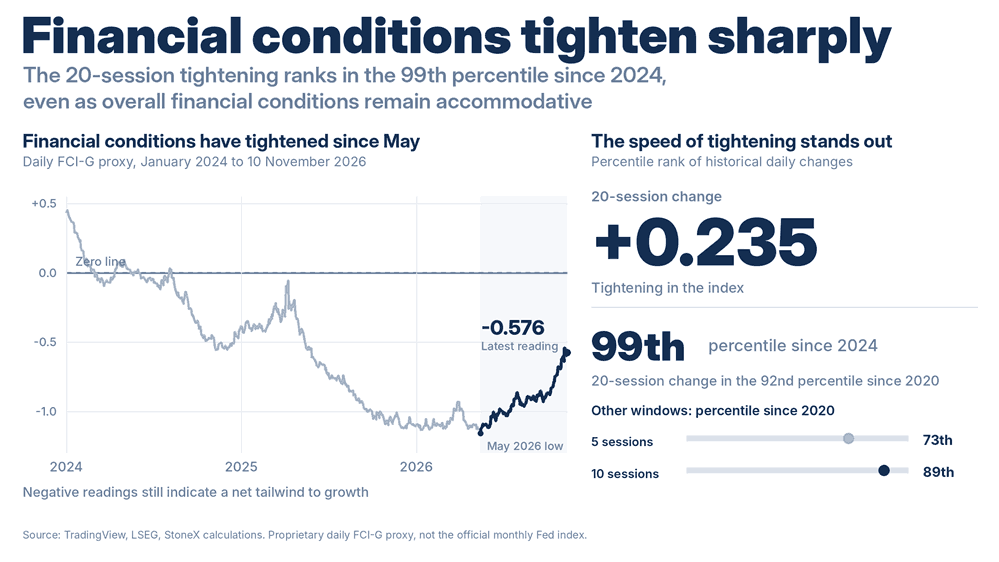
Source: TradingView
Our daily financial conditions model, designed to replicate the Fed's own Financial Conditions Impulse on Growth (FCI-G) index, which is published monthly, suggests substantial tightening has already occurred. The index has risen 0.235 points over the past 20 trading sessions, a move in the 99th percentile of observations since 2024. However, at −0.576, the latest reading still indicates that financial conditions are providing a tailwind to economic growth.
At face value, this suggests markets are already doing some of the Fed's work. But preserving the tightening in financial conditions requires policymakers to follow through with action, rather than simply talking tough about what they might do.
USD/JPY leads G10 rate sensitivity
Coinciding with the latest hawkish recalibration in the Fed interest rate outlook, there are signs that FX markets may be shifting their focus away from AI investment as a proxy for the US nominal growth outlook and back towards interest rate differentials. Our analysis shows a 20-day correlation of +0.55 between daily changes in two-year USD OIS rates and the US Dollar Index (DXY), suggesting changes in US interest rate expectations are becoming an important influence on currency movements once again.
The relationship is especially pronounced for USD/JPY, where the 20-day correlation stands at +0.77, the strongest among the G10 FX pairs examined. USD/CAD also shows a positive correlation of +0.46, although not as strong as against the yen. Separate analysis published yesterday also showed a strong positive relationship between USD/CAD and changes in US–Canada one-year OIS spreads, providing further support for the relative interest rate argument.
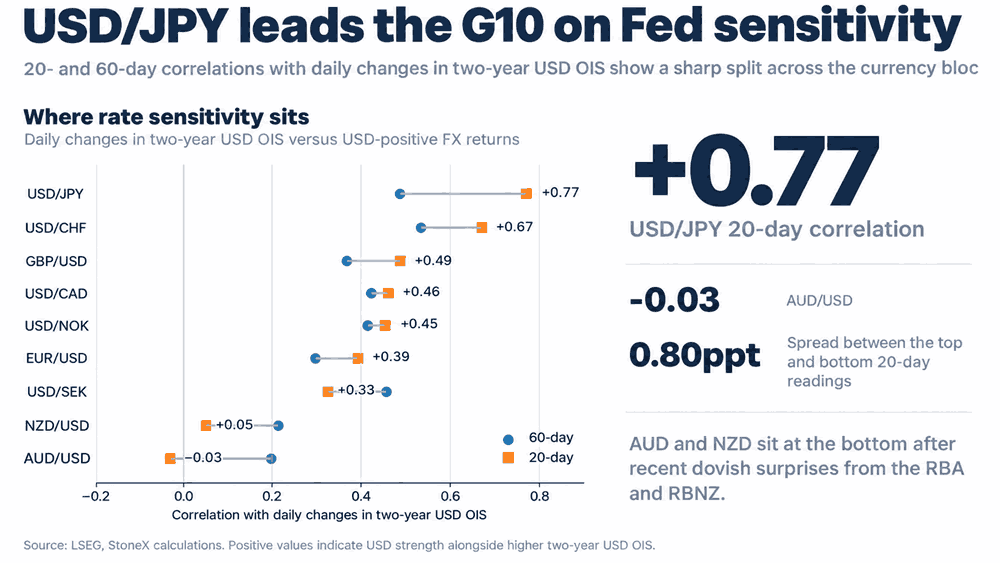
Source: LSEG
Notably, the relationship has been far weaker for the Australian and New Zealand dollars, potentially reflecting the influence of domestic factors in both countries, including dovish policy surprises from their respective central banks over the past month.
Volatility and Fed sensitivity tell different stories
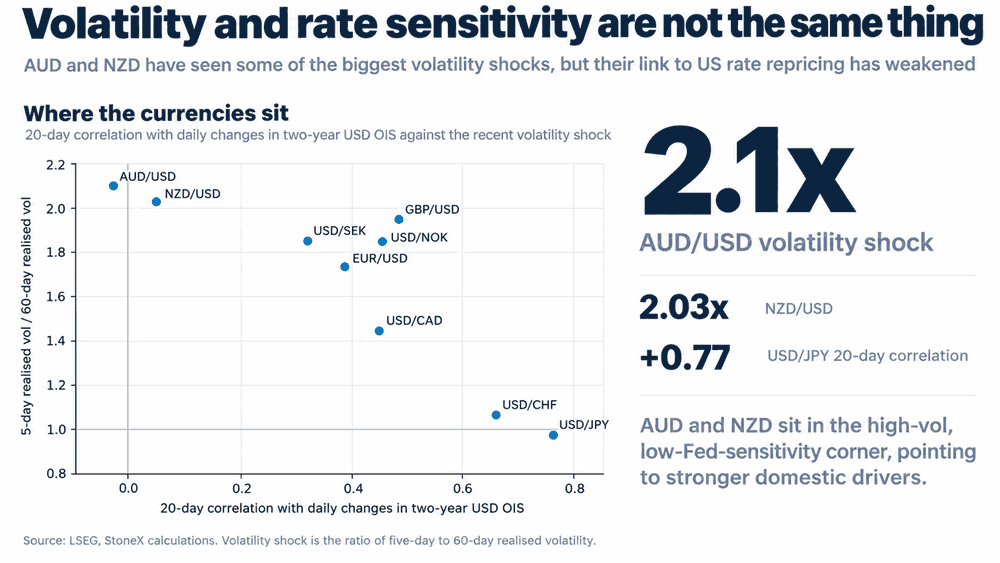
That assessment is reinforced by the scatterplot below, which shows that despite having among the weakest correlations with changes in US interest rate expectations, AUD and NZD have experienced the largest relative increases in volatility across the G10 FX pairs examined.
AUD/USD's five-day realised volatility is currently 2.1 times its 60-day level, with NZD/USD close behind at 2.03 times. Yet their respective 20-day correlations with changes in two-year USD OIS rates stand at just −0.03 and +0.05. By contrast, USD/JPY has a much stronger correlation of +0.77 despite experiencing a far smaller volatility shock.
Source: LSEG
The findings reinforce the view that USD/JPY currently offers the clearest read on changes in Fed interest rate expectations, rather than simply being one of the more volatile G10 currency pairs.
USD/JPY: Range resistance back in focus
Source: TradingView
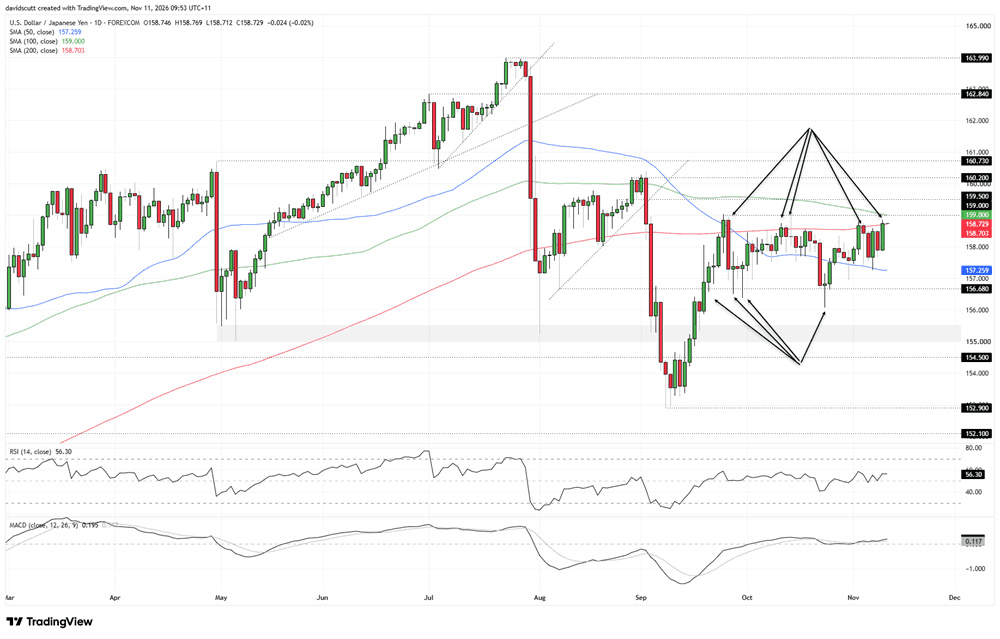
Despite showing the strongest sensitivity to changes in the US interest rate outlook, one look at the USD/JPY daily chart reveals the pair has been largely range-bound for the better part of two months. The latest bout of dollar strength has pushed the price back towards the upper end of that range, where the 200-day moving average at 158.70, horizontal resistance at 159.00 and the 100-day moving average at 159.00 combine to form a formidable resistance zone.
Previous approaches towards this region have often been accompanied by verbal intervention warnings from Japanese officials, including Finance Minister Satsuki Katayama and currency diplomat Atsushi Mimura. However, with interest rate differentials increasingly favouring the dollar, a break above 159.00 that sticks, preferably followed by a backtest and bounce, could provide an appealing entry point for longs. Levels at 159.50, 160.20 and 160.73 would then come into focus for bulls, allowing for a stop to be placed beneath the breakout zone for protection.
Alternatively, another rejection from the resistance zone would leave the price vulnerable to a renewed pullback. Buying interest has emerged beneath 158.00 over recent sessions, while the 50-day moving average at 157.26 has attracted bids on several occasions over the past fortnight. Further down, 156.68 remains an important level of note. Despite being breached repeatedly over recent months, the price has consistently been bid back above it on every occasion.
The message from the oscillators marginally favours longs over shorts, with RSI (14) sitting above the neutral 50 level at 56.38 and having recently set a higher high. MACD is also marginally positive and remains above its signal line. However, given the proximity to the upper end of the prevailing range, greater emphasis should be placed on price action, particularly whether the price can deliver a sustained break above 159.00 before considering bullish setups.
USD/CAD: Bullish case builds after upside target hit
Source: TradingView
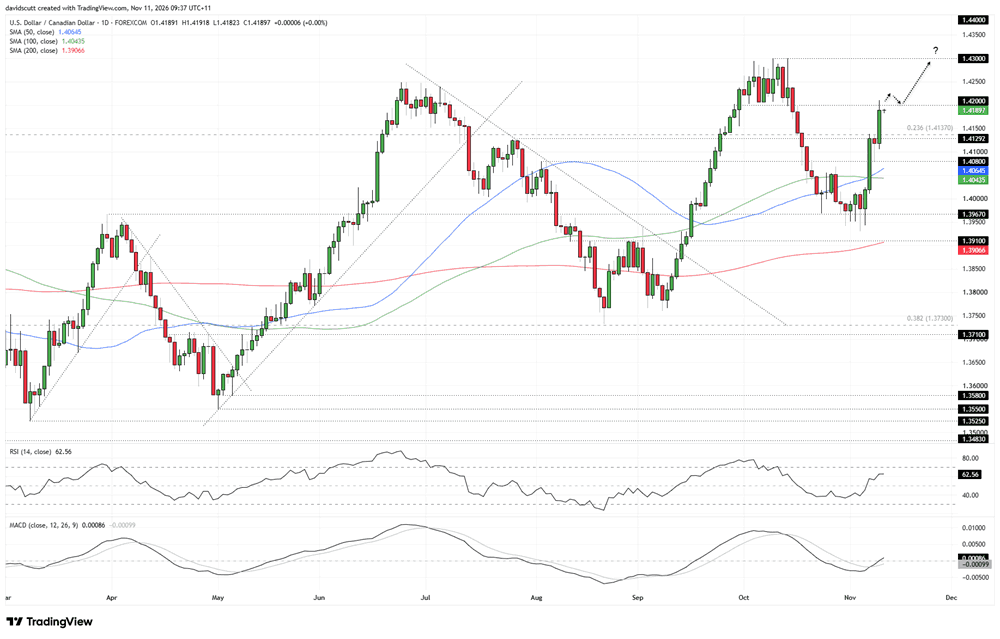
The upside risks flagged in our USD/CAD analysis yesterday came to fruition on Tuesday, with the pair reaching the first of our topside targets at 1.4200. While the price retreated beneath that level towards the close, it hasn't strayed far and is testing it again in early Asian trade.
A sustained push above 1.4200, preferably followed by a backtest and bounce, could provide an appealing entry point for longs, allowing for a tight stop to be placed beneath the level for protection. The initial upside target would be 1.4300, where the pair formed a double top in October, with 1.4400 another level of note beyond that.
Alternatively, continued rejection at 1.4200 would leave the option of countertrend shorts, with a tight stop above the level for protection. The initial downside target would be the 23.6% Fibonacci retracement of the 2021–2025 bull move, reinforced by horizontal support at 1.4129.
The message from the oscillators is one of building upside momentum. RSI (14) sits just below 63 and continues to set higher highs, while MACD has staged a bullish crossover and moved into positive territory. Both reinforce the growing upside pressure behind the latest rebound, favouring long setups over shorts.